An international baby name trend methodology is a written set of rules for putting name statistics from different countries side by side: which dataset each number comes from, which year it describes, whether it is a rank, a count or a share, and how spelling and small numbers were handled before anything was compared. This page turns those rules into a dashboard method you can actually build, using the U.S. Social Security Administration and the Office for National Statistics for England and Wales as the two working systems. The angle is reproducibility: every cell on the screen should be checkable by a stranger with the same files.
What to carry away
- Five fields, every time. A cross-country name trend is only readable when each value travels with its rank, count, share, year and source. Drop one and the comparison quietly breaks.
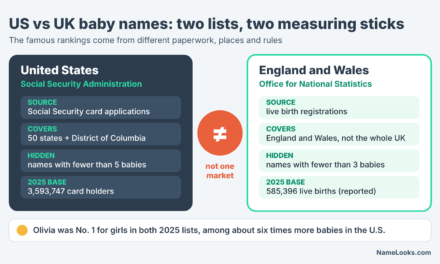
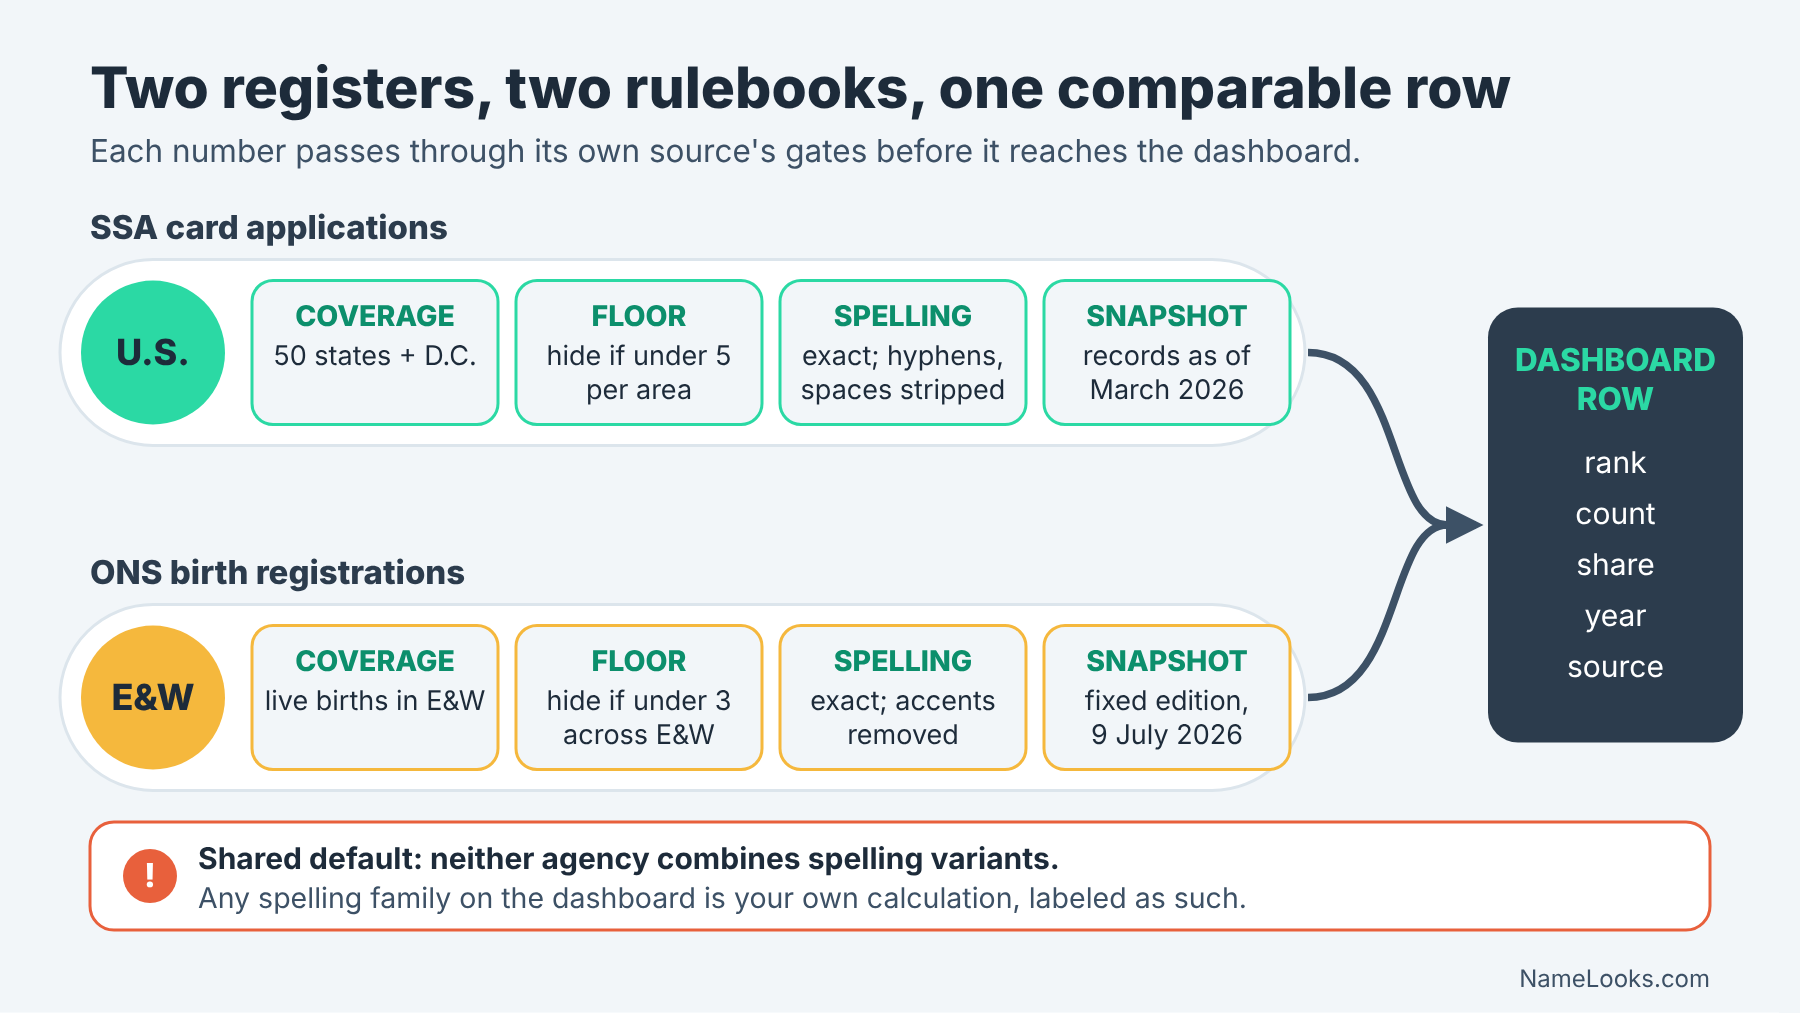
- Two registers, two rulebooks. SSA counts Social Security card applications and hides names used fewer than five times in an area; ONS counts birth registrations and withholds names with fewer than three in England and Wales as a whole.
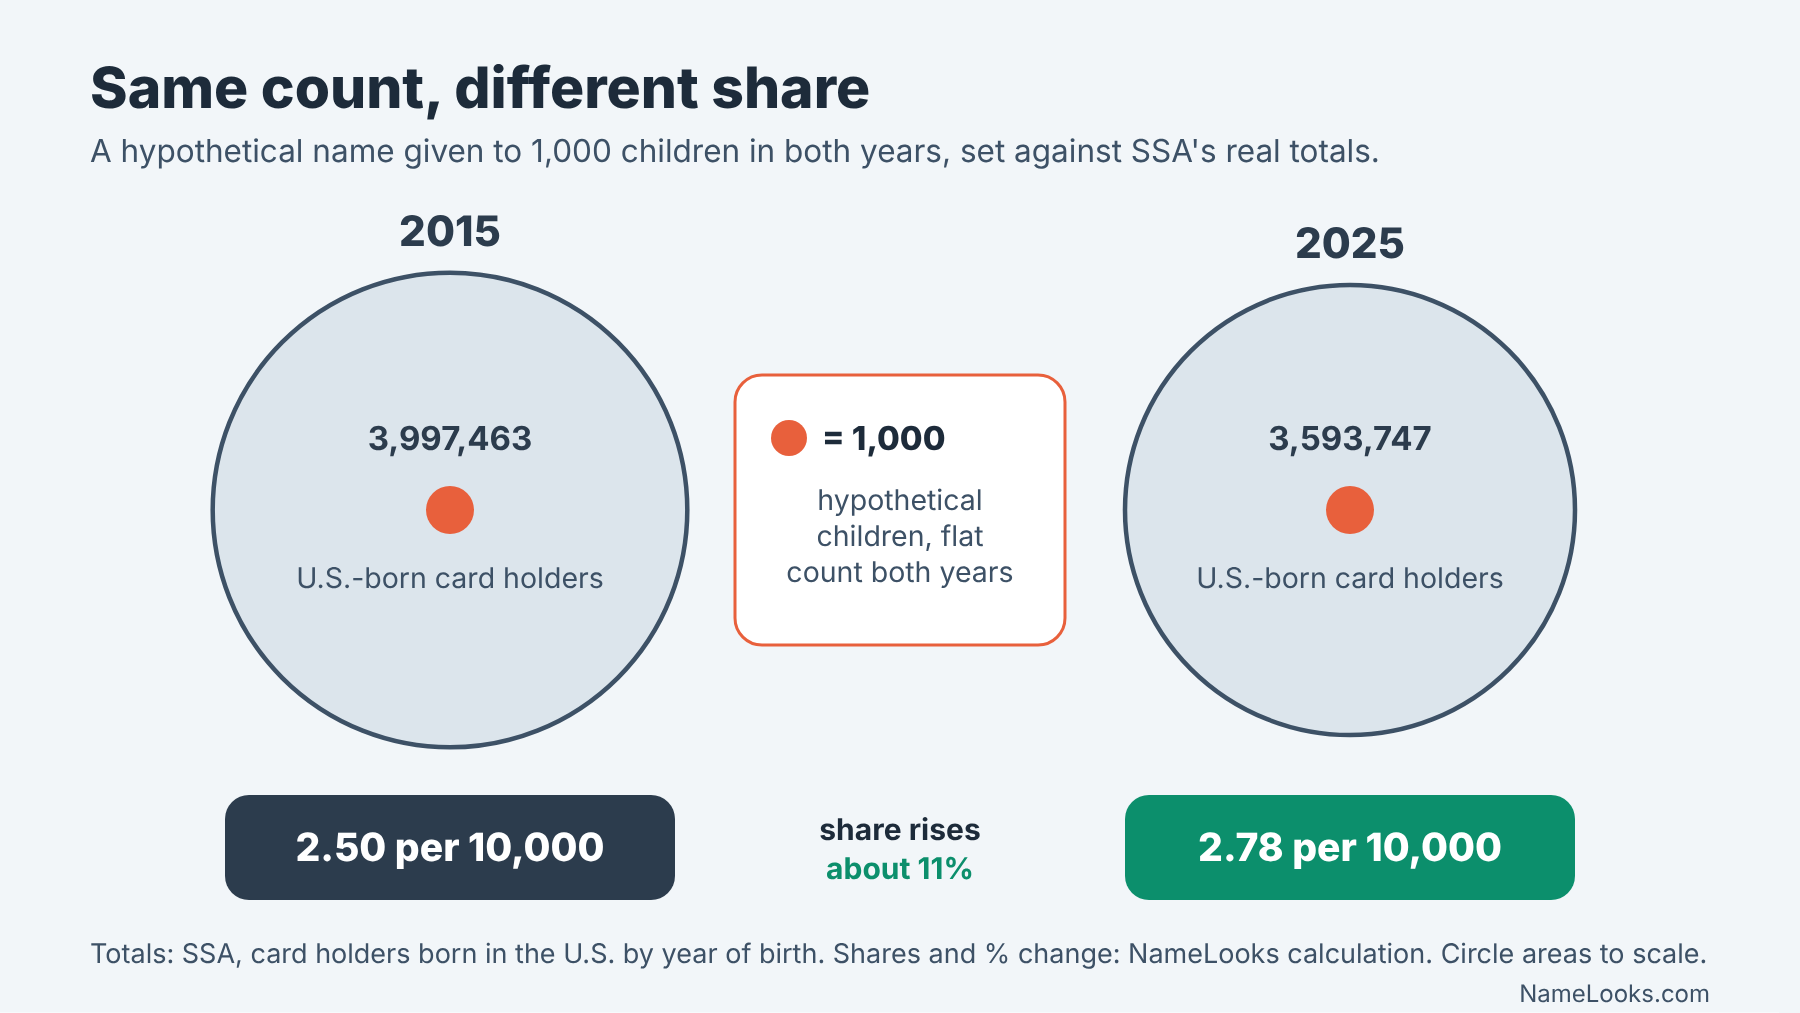
- Share is the bridge, and you have to build it. Neither headline list hands you a share; you divide a count by a denominator you name, and the denominator itself moves. SSA’s card-holder total fell from 3,997,463 (2015) to 3,593,747 (2025).
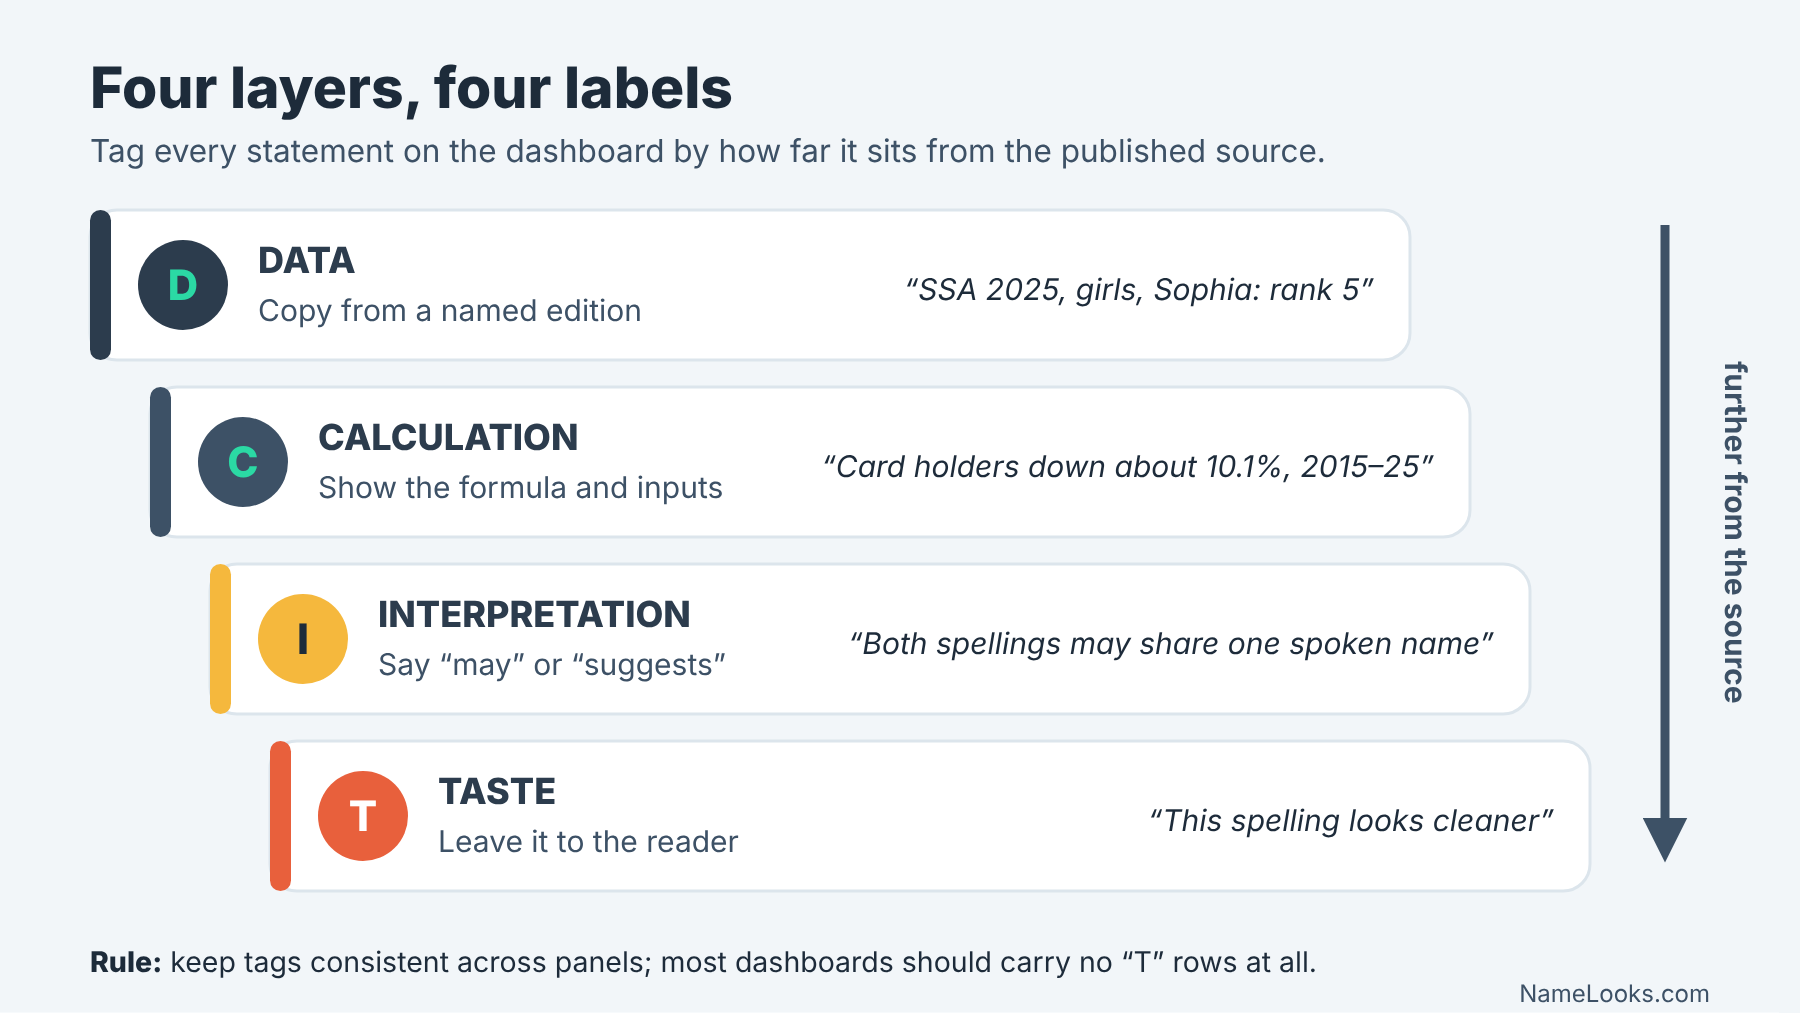
- Label the layer. Keep four kinds of statement visibly apart on the screen: published data, your calculation, your interpretation, and taste.
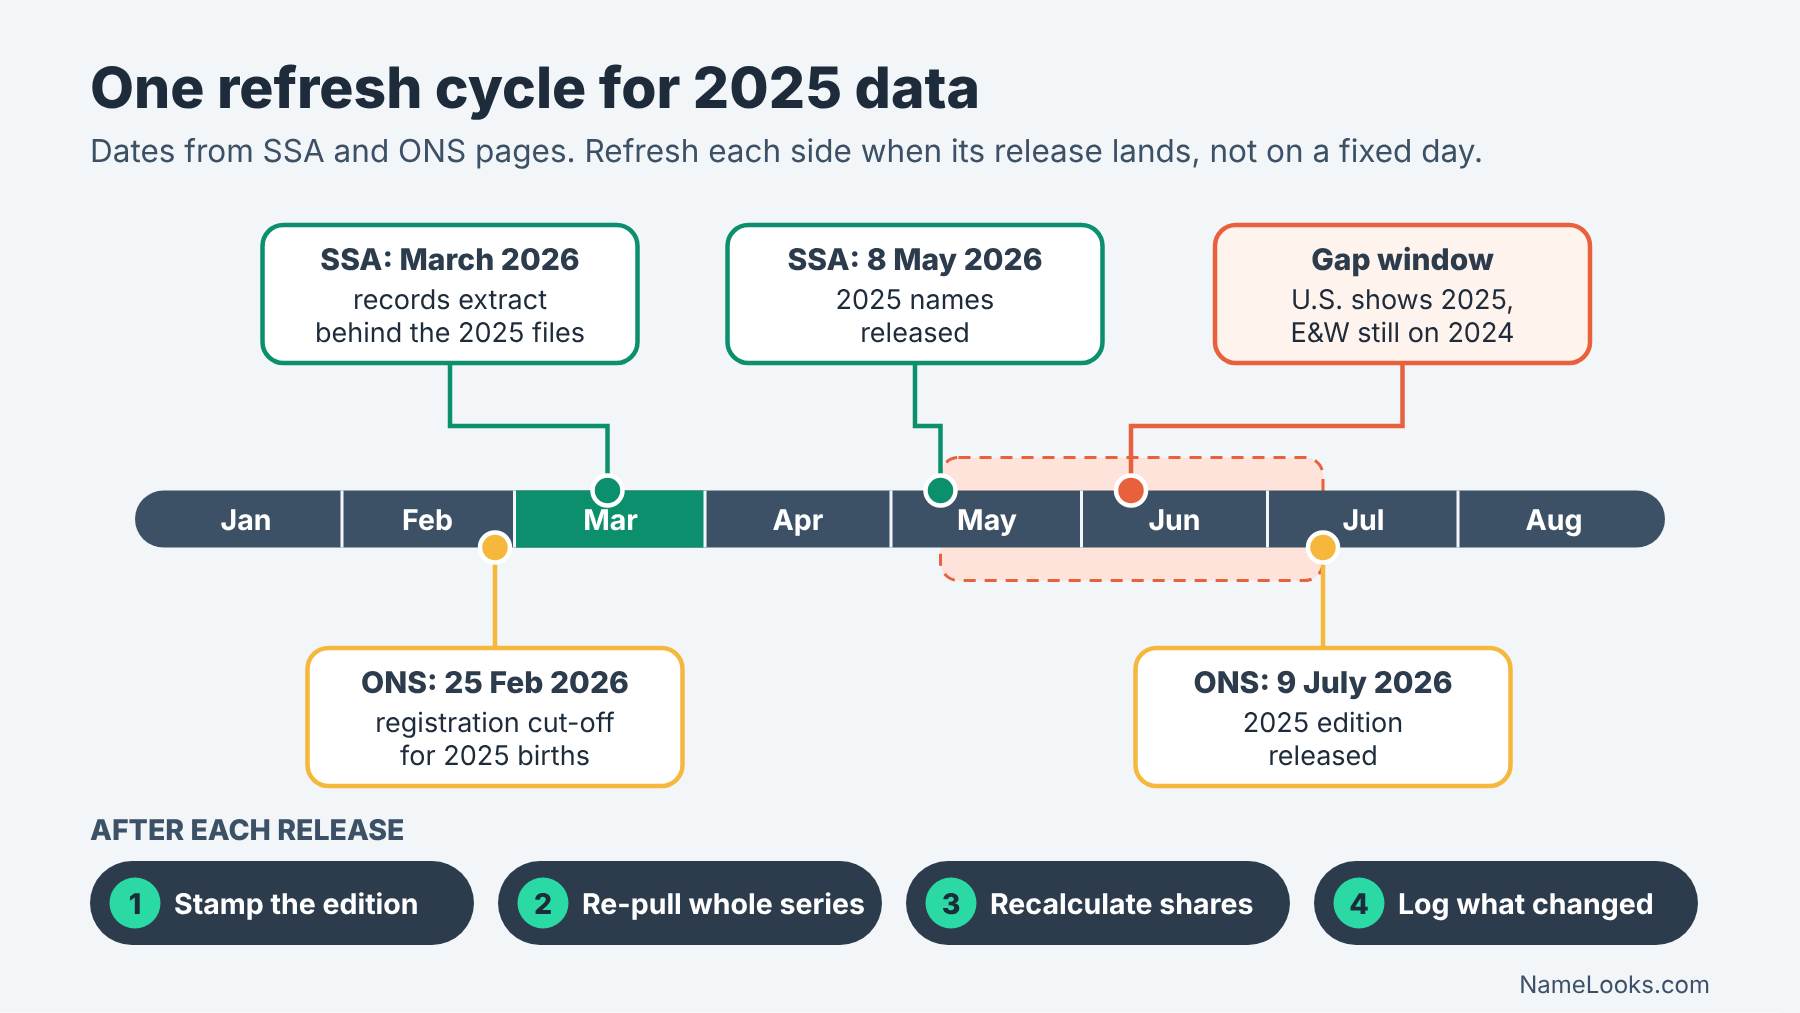
- Stamp the edition. SSA’s 2025 files reflect records as of March 2026; ONS’s 2025 tables are a fixed snapshot released 9 July 2026. A dashboard without edition stamps can’t be audited later.
1What a cross-country name dashboard must show before it shows a trend
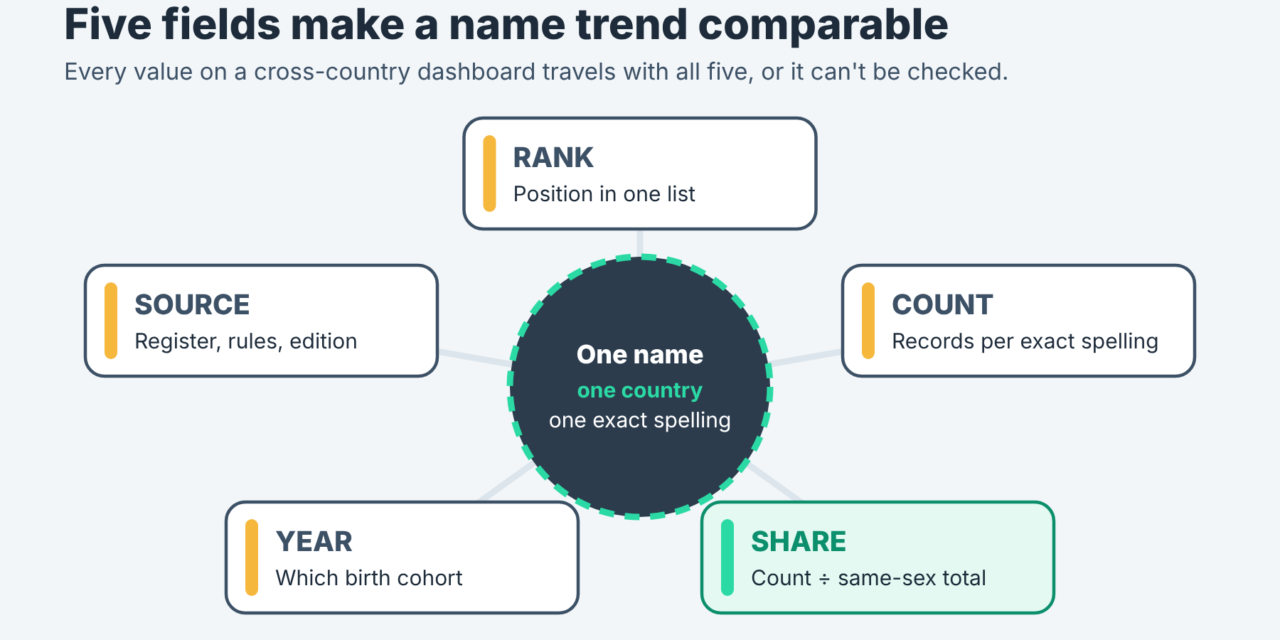
The short answer comes first. A defensible comparison of baby names across countries is not a single chart. It is a row of five fields, repeated for every country, every spelling and every year you show. Rank tells you position. Count tells you how many children. Share tells you how big that count is relative to everyone born. Year tells you which cohort. Source tells you which register, which edition and which rules produced the number.
Most of the confusion in cross-country name coverage comes from showing one of these fields and letting readers assume the other four. “Number one in both countries” sounds like a fact about two populations. It is really two facts from two systems with different counting rules, and it says nothing about how many children carry the name in either place. If you want the broad orientation to the England and Wales side first, our guide to using the ONS 2025 baby name data covers what the release contains. This page is narrower: how to lay out the numbers so they stay honest when two countries share a screen.
The five fields, and why none of them works alone
Think of the five fields as a sentence that only makes sense when it is complete. “Rank 5” is a fragment. “Rank 5 among girls’ names on SSA card applications for U.S. births in 2025” is a sentence. You can still misuse it, but at least you can check it.
Rank and count answer different questions
Rank is an ordinal position inside one list. It tells you that a name was used more often than the names below it and less often than the names above it, in that dataset, for that sex category, that year. It does not tell you the size of the gaps. Two names can sit one rank apart and be separated by a handful of children or by thousands.
Count is the number of records the source attaches to an exact spelling. It is the closest thing to a physical quantity in the whole exercise. But counts don’t travel well between countries on their own, because the populations behind them are different sizes. A count that looks small next to a U.S. figure can represent a much larger slice of births in England and Wales. That is why the third field exists. Our sibling piece on why position alone can mislead works through the rank-versus-count problem inside the U.S. data; the cross-country version is the same problem with an extra population in the room.
One more rank detail matters for dashboards. SSA’s background notes say that names with the same frequency in a birth year are ranked alphabetically, so a tie in count can still produce two different rank numbers. The ONS methodology page we read does not describe its tie rule. If your dashboard sorts by rank, it should also show the count, so ties don’t masquerade as differences.
Share, year and source make the row comparable
Share is count divided by a stated total: children of that sex in the dataset for that year, usually. It is the field that lets a reader compare magnitude across populations of different sizes. It is also the field most likely to be computed carelessly, because the right denominator differs by country and by sex category. We give it a whole section below.
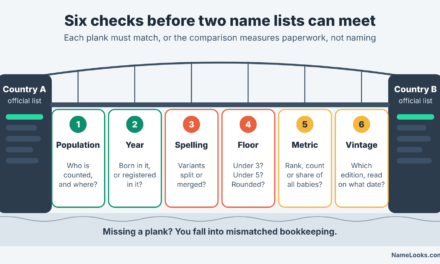
Year sounds trivial until you notice that the two systems define it differently. SSA ties a name to the year of birth recorded on a card application. ONS counts live births occurring in the calendar year and registered by a cut-off early the following year, plus a small number of late registrations from the year before. Those are both reasonable definitions. They are not identical, and a dashboard should say which one each column uses.
Source is not a footnote. It is the field that carries the rules: the suppression threshold, the spelling treatment, the coverage area, the edition date. A reader who sees “SSA 2025 (records as of March 2026)” and “ONS 2025 (released 9 July 2026)” next to each other already knows these are two different instruments.
A one-line test for any cross-country name claim
Ask whether a stranger could rebuild the number from what is printed. If the claim names the register, the geography, the year, the metric and the exact spelling, they can. If any of those is missing, the claim is a vibe with a number attached.
Why a dashboard instead of a headline list
A headline list answers “what was on top this year?” A dashboard answers “how do these names behave across places and time, and how sure can we be?” The second question is the one most readers actually have when they look at two countries, even if they phrase it as the first. Closing that gap is the whole job of an international baby name trend methodology.
What lists hide that a row of fields reveals
A top-ten list strips out count, share and every rule that shaped the ranking. That is fine for a press release. It becomes a problem when two lists are pasted next to each other, because the eye reads alignment as equivalence. Rank 2 in one country and rank 2 in another look like the same achievement. They aren’t, in any measurable sense, until you add counts and denominators.
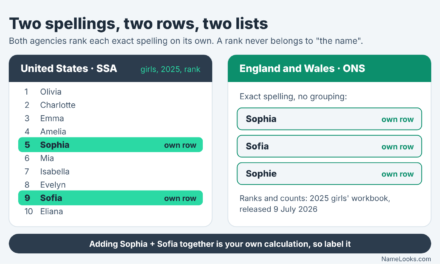
Lists also hide spelling decisions. SSA’s 2025 girls’ top ten, as published on its Popular Baby Names page, includes Sophia at 5 and Sofia at 9. Those are separate entries because SSA does not combine variant spellings. A list makes that look like two names. A dashboard can show both rows, flag them as related spellings, and let the reader decide whether to sum them, while making clear that any sum is your own calculation, not SSA’s.
A minimal layout you can sketch on paper
You don’t need software to plan this. Draw one horizontal band per country. Inside each band, one row per exact spelling. Across the top, five columns in fixed order: rank, count, share, year, source. Under the source column, put the edition date in small type. To the right, a narrow notes column for anything the reader must know before comparing: “spelling variants not combined”, “accents removed in processing”, “territories excluded”.
Then add time as a second dimension: the same layout repeated for each year, or a small line chart per row whose y-axis is share, not rank. Rank charts invert intuitively (up is “better”), exaggerate movement at the bottom of a list, and break whenever a name drops below a publication threshold. Share charts have their own traps, which we’ll get to, but they keep magnitude visible. For a decision-level view of how two specific countries differ, see comparing U.S. and England and Wales rankings without assuming one naming market.
2Write the international baby name trend methodology down first
The order matters. If you collect numbers first and decide the rules afterward, the rules tend to bend toward whatever story the numbers seem to tell. Writing the method first is the cheapest protection against that. It also gives you something to point to when a reader asks why your figure differs from a newspaper’s.
An international baby name trend methodology has two layers you should write in this order. First, the inputs: which registers, which geographies, which editions. Second, the transformation rules: thresholds, spelling treatment, grouping, and what you do when a value is missing. Everything else on the dashboard is an output of those two layers.
Inputs: what each register actually counts
Both of our working systems are administrative. Neither is a survey, and neither asked parents anything about why they chose a name. That shared feature is what makes them comparable at all. The differences sit in what triggers a record and who falls outside the net.
SSA: card applications for U.S. births
According to SSA’s background notes on the baby names data, the names come from Social Security card applications for births in the United States after 1879. The current files are a 100% sample of SSA’s records as of March 2026. A record qualifies only when it has a year of birth, a sex and a state of birth, and the given name must be at least two characters long.
Coverage is the 50 states and the District of Columbia. U.S. territories are excluded from the national figures and published separately: SSA’s territories page shows Puerto Rico on its own and combines American Samoa, Guam, the Northern Mariana Islands and the U.S. Virgin Islands into one table, with drop-downs covering 1998 through 2025. The background page also warns that many people born before 1937 never applied for a card, so older cohorts are incomplete.
The unit, then, is a person with a qualifying card record, not a registered birth. SSA labels its own total table that way: “Number of Social Security card holders born in the U.S. by year of birth and sex.” Your dashboard should use the same wording in the source field. The deeper mechanics are covered in how SSA’s rankings are assembled.
ONS: birth registrations in England and Wales
The ONS Baby names Quality and Methodology Information (QMI) says the statistics are based on birth registrations, which are a legal requirement. Coverage is live births occurring in England and Wales in the calendar year. Stillbirths are excluded, and so are births abroad to women usually resident in England or Wales.
Two coverage details are worth a line on any dashboard. Births in England and Wales to mothers usually resident elsewhere are included in the national totals but excluded from regional breakdowns. And the statistics cover first names only. The geography is England and Wales together, with country and regional splits by the mother’s usual residence. It is not the United Kingdom: the QMI notes that Scotland and Northern Ireland are handled by National Records of Scotland and the Northern Ireland Statistics and Research Agency.
The published inputs are the ONS “Baby names in England and Wales: from 1996” dataset, described as ranks and counts for boys and girls from 1996 to 2025, and the separate annual workbooks for boys and girls, which add breakdowns by country, region, mother’s age and month of birth. Several of those breakdowns have their own sibling guides on NameLooks, including what ONS regional data can show and how to read mother’s-age tables.
Adding a third country
The same two questions decide whether any new register belongs on the dashboard: what event creates a record, and who is outside the net? The ONS QMI says ONS, NISRA and NRS all build baby name statistics from birth registration, and that its exact-spelling approach is consistent with countries such as Scotland, Northern Ireland and the Netherlands. It also notes that New Zealand uses registration date rather than date of birth. Treat each newcomer as its own source row with its own rules, and open its methodology page before you add a single figure.
Thresholds, spelling and grouping: the rules that shape every cell
Once the inputs are fixed, the second layer decides which names appear at all and how spellings are treated. These rules are where two registers diverge most, and where dashboards most often apply one country’s logic to another country’s numbers.
Two suppression floors and two hyphen rules
SSA excludes names with fewer than five occurrences in any geographic area, to protect privacy. Its limitations page repeats the rule and adds that the public forms show only the top 1,000 names, while the downloadable national and state files carry almost all names for researchers. Because the floor applies to each area separately, state counts for a year can add up to less than the national count.
ONS uses a different floor. In the QMI’s words, “we do not release names with counts of fewer than three in England and Wales as a whole.” Comparison tables mark a name with “[x]” when it had fewer than three registrations in the comparison year. So the smallest published count is 5 on one side of your dashboard and 3 on the other. A name that is invisible in one country and barely visible in the other is not evidence of a difference in taste. It may just be the floors.
Spaces and hyphens are the second divergence. SSA removes hyphens and spaces from the first-name field, so its own example, Julie-Anne, Julie Anne and Julieanne, counts as one name. ONS changed its rule in 2018: before then, any text after a space was dropped, so “Amelia – Lily” became Amelia; since 2018, spaces are removed from hyphenated names so they are treated as one name. The QMI says the ranking impact was negligible, but any long ONS series that crosses 2018 is crossing a rule change.
Exact spelling, accents and the grouping question
Both registers count exact spellings. SSA says variants are not combined, giving Caitlin and Kaitlyn as separate ranked names. ONS says it does not group names “as some groupings are subjective and not straightforward,” and leaves grouping to users. That shared default is the most useful thing the two systems have in common, so keep it as your default too.
Accents are where they part. The ONS QMI states that part of the automated processing involves removing accents from names. In practice, a name registered with a diacritic is counted under its unaccented form in the published tables. SSA’s background notes, as we read them, don’t address diacritics at all, so we make no claim about how SSA handles them; the readme inside SSA’s zipped files is the place to check. Either way, your dashboard should not present an accented spelling as if it were the form either register published. The wider issue of accents in forms and search is covered in our piece on diacritics in names.
If you do group spellings, do it as a separate, clearly labeled layer. Show the exact-spelling rows first, then a “family” row that sums them, tagged as your calculation, with the grouping rule written out (“Sophia + Sofia, exact spellings only, no other forms”). Sound-alike grouping is a judgment call, and our sibling article on U.S. and UK spelling preferences works through why the choice of family members can swing a conclusion.
| Claim on the dashboard | Source / dataset | Geography | Year | Metric | Limitation | Editorial takeaway |
|---|---|---|---|---|---|---|
| Sophia ranked 5 and Sofia ranked 9 among U.S. girls’ names | SSA Popular Baby Names, top 10 of 2025 | 50 states + D.C. | Birth year 2025 | Rank, by exact spelling | Variants are separate entries; counts not on the top-10 page | Show both rows; any combined figure is your calculation |
| 3,593,747 U.S.-born card holders in birth year 2025 | SSA card-holder table by year of birth and sex | U.S. births | 2025 | Count of card holders (1,835,823 boys; 1,757,924 girls) | Card records, not registered births | Usable denominator for SSA shares, if labeled as card holders |
| Names with fewer than 3 registrations are not released | ONS Baby names QMI | England and Wales as a whole | Applies to each annual edition | Publication threshold | Absence from the tables does not mean zero births | Mark “below threshold” rather than leaving cells blank |
| Accents are removed in processing | ONS Baby names QMI | England and Wales | Current method (QMI revised October 2022) | Spelling treatment | Accented and unaccented forms are merged in published counts | Never display an accented form as an ONS spelling |
| Hyphens and spaces stripped, so Julie-Anne = Julieanne | SSA background notes | U.S. national and state files | Current files | Spelling treatment | Different-looking forms merge into one entry | Search the unhyphenated form when matching across registers |
| Top 100 lists exist for 1904–2024 at ten-year intervals | ONS Top 100 historical dataset | England and Wales | 1904–2024 | Rank only, decade snapshots | Counts not available before 1996 | Don’t splice pre-1996 ranks into an annual count series |
Notice what the matrix does to vague claims. “Sophia is popular on both sides of the Atlantic” can’t be entered as a row, because it has no geography, year or metric. To enter it, you’d have to look up the exact spelling in the ONS 2025 girls’ workbook and record its rank and count, then decide whether the U.S. side is Sophia alone or Sophia plus Sofia. That’s the point. The matrix forces the claim into a checkable shape, and our sibling piece on comparing popularity across different data systems goes further into matching rules.
3Normalize first: shares, denominators and change you can defend
This is the section where a dashboard either earns trust or loses it, and where an international baby name trend methodology does most of its real work. Counts are published; shares and changes are almost always computed by whoever builds the comparison. That makes them your responsibility, and it means every one of them should be labeled as a calculation with its inputs visible.
Turning counts into shares without hiding the denominator
A share is simple arithmetic: the count for an exact spelling divided by the total for the matching group, often expressed per 1,000 or per 10,000 children. The hard part is choosing the total, and then keeping that choice on the screen.
Which total belongs under which count
For SSA figures, the natural denominator is SSA’s own table of Social Security card holders born in the U.S., split by year of birth and sex. It comes from the same records as the name counts, so numerator and denominator share one definition. For birth year 2025, it lists 1,835,823 boys and 1,757,924 girls, 3,593,747 in total.
Use the sex-specific total for a sex-specific count. SSA ranks names separately for boys and girls, and a girls’ count divided by the all-children total understates the girls’ share by roughly half. It’s an easy slip and it makes every share on the screen wrong in the same direction, which is why it often survives review.
For ONS figures, the matching denominator is the number of live births of that sex in the same edition of England and Wales registration data. We could not open an ONS page in this session that states the 2025 births total, so we don’t print one here. On your own dashboard, take it from an ONS publication you can cite, record the table and edition, and avoid mixing an ONS name count with a births figure produced on a different registration cut-off.
Whatever you choose, show it. A small “per 10,000 girls, denominator: SSA card holders, 2025” under the number costs one line and removes most of the room for misunderstanding.
Worked example: the shrinking denominator
Here is why share matters even inside one country. SSA’s card-holder table lists 3,997,463 U.S.-born card holders for birth year 2015 and 3,593,747 for 2025. By our calculation, that is a fall of 403,716, or about 10.1%.
Now imagine a hypothetical name given to exactly 1,000 children in both years. Its count is flat. Its share is not: by our arithmetic, 1,000 is about 2.50 per 10,000 card holders in 2015 and about 2.78 per 10,000 in 2025, an increase of roughly 11%. A dashboard showing only counts would call this name stable. A dashboard showing only shares would call it rising. Both are true, and that is the point of showing both with their denominators.
The effect also runs the other way. A name whose count falls slowly during a period of falling totals can hold a steady share. If you are reading trend claims built on counts alone, ask what happened to the total in the same years. Our sibling on why a name can rank differently in England and Wales than in the U.S. explains how population size and list depth shape the positions themselves.
Measuring change without rank theater
“Rose 500 places” is the most quotable sentence in name data and one of the least informative. Rank change is real, but on its own it mostly measures how crowded the list is at the name’s position.
Why jumps at the bottom of a list look so dramatic
Near the top of a ranking, each step separates names by many children. Far down the list, hundreds of names sit at very similar counts, so a small change in count can move a name hundreds of places. SSA’s 2025 announcement illustrates the scale: in its May 8, 2026 press release, SSA said Kasai rose 1,108 positions to enter the top 1,000 at number 639, its first time in the top 1,000. That is a genuine signal that usage grew. The size of the jump, though, mostly reflects where on the list the name started.
SSA’s own change-in-popularity page spells out its comparison rule: ranks for 2024 and 2025 are compared only if a name was in the top 1,000 in at least one of the two years. That rule is sensible, and it also means “fastest-rising” is defined relative to a list boundary. For more on reading those risers, see rank jumps versus real birth counts in 2025.
Cross-country, rank change gets worse. The ONS list and the SSA list have different depths and different floors, so the same count change produces different rank changes in each. Comparing “rose 300 places in England and Wales” with “rose 300 places in the U.S.” compares two rulers, not two trends.
Pick a change metric and say which one you picked
We’d suggest showing change in this order of preference, and labeling it each time:
- Change in share, per 10,000 children of that sex, between two named years. Best for cross-country comparison, provided both denominators are stated.
- Change in count, as a raw number. Best for a single country, and easy for readers to verify against the published tables.
- Ratio of shares (later share divided by earlier share). Useful for small names, where “doubled” is more informative than “+0.4 per 10,000”.
- Rank band (top 10, 11–100, 101–500 and so on) rather than exact rank change. Readable, honest about precision, and robust to tie rules.
Exact rank change can still appear, but as supporting detail. It should never be the only number on a cross-country trend card.
| Variant or period | Rank / count / source form | Change | Caveat | Naming implication |
|---|---|---|---|---|
| SSA card holders, 2015 vs 2025 | Count: 3,997,463 vs 3,593,747 (SSA card-holder table) | About −10.1% (our calculation) | Card holders, not registered births | A flat count means a rising share; check totals before calling a name “steady” |
| SSA card holders, 2024 vs 2025 | Count: 3,628,418 vs 3,593,747 | About −1.0% (our calculation) | Single-year moves in the total are small but not zero | Year-on-year share and count changes will differ slightly |
| Sophia vs Sofia, U.S. girls, 2025 | Rank 5 vs rank 9 (SSA top 10 of 2025) | Separate entries, not a change | SSA does not combine spellings | Decide whether you care about the written form or the spoken name before reading either rank |
| Girls’ rank 2 in the U.S., 2024 to 2025 | Emma 2 in 2024; Charlotte 2 in 2025 (SSA top-5 history) | SSA says Charlotte ended Emma’s six-year run at number 2 | Rank swap only; counts not shown here | A swap near the top can reflect a small count gap; look up both counts |
| Kasai, U.S. boys, 2024 to 2025 | Entered the top 1,000 at 639 (SSA press release) | Up 1,108 positions | Jumps are larger far down the list | Real growth signal; the size of the jump is not the size of the trend |
| James and Mary, U.S., 1926–2025 | Counts 4,505,076 and 2,845,637 (SSA 100-year table) | About 2.50% and 1.63% of their sex totals (our calculation) | James ranked as low as 19, Mary as low as 134 in individual years | Long-run totals and single-year ranks tell different stories; show both |
The last row comes from SSA’s Top Names Over the Last 100 Years page, which gives totals of 180,126,408 boys and 174,147,370 girls for 1926–2025 and notes that its top names were not consistently popular in every year. It’s a tidy reminder that aggregation choices are part of the method. A hundred-year total, a decade total and a single year can rank the same names in different orders without any of them being wrong.
4Keep what the data says apart from what you think it means
A dashboard looks objective because it is full of numbers. That appearance is exactly why it needs a visible line between evidence and opinion. Readers give a chart more authority than a paragraph, so anything interpretive that sneaks into a chart title or a color choice gets read as fact.
What the registers establish, and how far that goes
Start with a narrow list of things the sources genuinely support. Then notice how quickly ordinary trend language steps past it.
Statements SSA and ONS data can carry
From the documentation we opened, the two registers support statements of this shape: in a named year and geography, this exact spelling appeared this many times among records of this sex category, which placed it at this rank under this source’s rules. With a stated denominator, you can add a share. With two editions, you can add a change. That’s the full menu.
They also support a few negative statements. A name absent from SSA’s files was used fewer than five times in that area, or not at all; you can’t say which. A name absent from the ONS tables had fewer than three registrations in England and Wales as a whole, or none. SSA’s notes add that its data is not edited: the sex attached to a name may be wrong, and entries such as “Unknown” and “Baby” are retained. ONS describes its annual dataset as a fixed snapshot, so later corrections to registrations are not reflected.
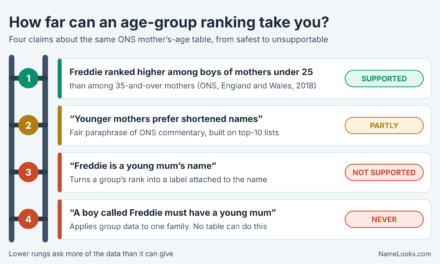
What neither register establishes is anything about meaning, origin, the family’s background, or the child’s identity. Name popularity is population-level information. It describes how often a spelling was recorded, not who the people carrying it are. That rule is binding on every label, tooltip and caption, and our guide on what birth and Census data can show about unisex use applies the same discipline to sex categories.
Rewriting common claims into checkable ones
Here’s a practical drill. Take a headline-style claim and rewrite it until every word is supported.
- “Olivia rules the English-speaking world.” Unsupported as written. Checkable version: “Olivia was the top girls’ name on SSA card applications for U.S. births in 2025,” which SSA’s top-five history page confirms. Any England and Wales clause needs its own ONS 2025 rank and count, looked up and cited separately.
- “Sofia is catching up with Sophia.” Needs two years, two exact spellings and a metric. Checkable version: “In SSA’s 2025 data, Sophia ranked 5 and Sofia 9 among girls; compare their counts across two named years to judge convergence.”
- “This name is huge in Britain.” Wrong geography for ONS data, and no metric. Checkable version names England and Wales, the year, the sex category and the rank or count.
The rewrites are longer and less exciting. They are also the only versions that would survive a reader opening the source. Sibling article why “popular worldwide” is usually an overclaim goes deeper on the geography problem in particular.
Where interpretation, taste and inference enter the screen
Interpretation isn’t the enemy. A dashboard with no interpretation is a spreadsheet. The goal is to make each interpretive step visible and attributable, so a reader can accept your numbers and still disagree with your reading of them.
Four labels for four kinds of statement
Of all the parts of an international baby name trend methodology, labeling is the one readers notice least and lean on most. We use a simple scheme, and it works on paper as well as on screen. Every statement on the dashboard gets one of four tags:
- Data. Copied from a named source edition without change: a rank, a count, a published total. Example: “SSA 2025, girls, Sophia, rank 5.”
- Calculation. Arithmetic you performed on data, with the formula visible. Example: “Card holders fell about 10.1% from 2015 to 2025 (our calculation from SSA’s table).”
- Interpretation. A reading of the pattern that someone could reasonably dispute. Example: “The two spellings may be drawing on the same spoken name.” Phrase these with “may”, “suggests” or “we read this as”.
- Taste. Aesthetic judgment, which belongs to the reader or the parents, never to the data. Example: “This spelling looks cleaner to us.” Most dashboards should contain none of these at all.
The tags can be tiny: a letter in a corner, a font style, a color band. What matters is consistency. If calculated shares are italic in one panel, they’re italic everywhere.
Inference you should refuse to draw
Some inferences are not just weak but off limits. A cross-country dashboard should never suggest that a name’s use in one country says something about the ethnicity, religion, nationality or ancestry of the people using it in another. Aggregate counts can’t support that, and attaching such a story to a chart invites stereotyping of real children.
The same goes for meaning. Registers record spellings; they don’t record etymology. If your dashboard has a “meaning” field, it must come from separately sourced onomastic references, and it should sit in a different panel from the popularity data. Mixing them on one card implies the numbers support the meaning, which they never do. For how to research that side properly, see NameLooks’ guide to researching name etymology without repeating myths.
Picture a hypothetical case. A designer builds a “names trending across borders” panel and colors rows by a guessed language of origin. The colors look informative. They are actually unsourced claims about origin, layered on top of sourced counts, and they make the counts look as if they prove the origin. The fix is not a better guess. It’s removing the color and, if origin matters to the story, adding a separately cited note per name.
Design choices are claims too
A red-to-green color scale implies good and bad. An arrow implies momentum. A “trending” badge implies a forecast. If a visual element asserts something, it needs the same support as a sentence. When in doubt, use neutral colors and let the share line speak.
5Publish your limitations so someone else can reproduce them
Every dataset has gaps. The difference between a careful dashboard and a careless one isn’t whether gaps exist; it’s whether the reader can see them and repeat your steps. A limitation written as “data may be incomplete” helps nobody. A limitation written as “names with fewer than three registrations in England and Wales are not released, so blank cells on the ONS side mean 0–2, not 0” helps everyone. Written limitations are also the part of an international baby name trend methodology that a reader can audit without any software.
Missing data and edge cases to declare up front
Write these into a methods note that sits one click from the dashboard. The note should be specific enough that a skeptical reader could rebuild any cell from it.
What falls outside each register
Drawing only on the documentation we opened, here is what each system leaves out:
- SSA: names with fewer than five occurrences in an area; births in U.S. territories (published separately); people who never applied for a card, a notable gap for those born before 1937; records missing a birth year, sex or state of birth; one-character names.
- ONS: names with fewer than three registrations in England and Wales as a whole; stillbirths; births abroad to mothers usually resident in England or Wales; mothers usually resident elsewhere in regional splits; anything other than the first name.
- Both: the reasons for the choice, pronunciation, and how the name is used day to day. Neither register records nicknames or spoken form.
Two of those gaps deserve their own visual treatment. Below-threshold cells should look different from zero, perhaps a hatched cell with “<5” or “<3”, because “not published” and “not used” are different facts. And historical depth differs: ONS counts are unavailable before 1996, while the ONS historical top 100 dataset offers ranks for 1904 to 2024 at ten-year intervals. A line chart that runs smoothly from 1904 to 2025 on the England and Wales side has spliced two kinds of data, and should show the seam. Thresholds also have a privacy dimension, which our article on the privacy problem with extremely rare name data explains.
Edge cases that break naive matching
Cross-country matching is usually done by string: take a spelling from one table, find it in the other. These cases break that approach:
- Hyphens and spaces. SSA strips them, so search its files for the joined form. ONS has removed spaces around hyphens since 2018 and dropped text after a space before that. A hyphenated name can therefore exist in one register’s tables and not in the other’s under the “same” string.
- Accents. ONS removes them in processing. If your input list carries accented spellings, normalize them before matching against ONS tables, and note that you did.
- Sex categories. Both registers publish boys and girls separately. A name used in both columns has two ranks, and SSA notes that when no sex is specified its lookup shows the more popular name-sex combination. Show both rows rather than picking one.
- Placeholders. SSA’s unedited data keeps entries such as “Unknown” and “Baby”. Filter them out of any “top names” view and say that you did.
- Cohort definitions. SSA keys on year of birth; ONS takes births occurring in the year and registered by 25 February of the following year (11 February for 1996 to 2000), plus late registrations that missed the previous cut-off. Treat them as close, not identical.
The ONS QMI flags one more historical seam worth copying into any long-series note: before 2009, the General Register Office used only births registered in the first 46 weeks of the year, which could introduce seasonal bias. That matters most for analyses by month, covered in our guide to month-of-birth trends.
A methods note you can copy
“U.S. figures: SSA Popular Baby Names, national file, birth years shown, 100% sample of card records as of March 2026; exact spellings; names with fewer than 5 occurrences excluded; territories excluded. England and Wales figures: ONS Baby names in England and Wales, 2025 edition released 9 July 2026; exact spellings with accents removed by ONS; names with fewer than 3 registrations not released. Shares are our calculation: count divided by the same-sex total named under each chart. Spelling families, where shown, are our grouping and are listed in full.”
Freshness: an update rule you announce in advance
Name data is published on a calendar. A dashboard that ignores the calendar ends up mixing editions, and an older edition of one country next to a newer edition of another is a quiet source of error.
How each source dates itself
SSA’s 2025 names were announced on May 8, 2026, and its background notes describe the files as reflecting records as of March 2026. The ONS release page for “Baby names in England and Wales: 2025” gives a publication date of 9 July 2026, and the 1996-to-2025 dataset lists the next release as “to be announced.”
The methodology documents have dates of their own. The ONS QMI we opened shows a last revision of October 2022 and says the release comes around nine months after the end of the data year; the 2025 edition actually appeared in July 2026. That gap isn’t a scandal. It’s a reason to take release dates from release pages and rules from the QMI, and to recheck the QMI whenever a new edition lands.
Snapshots also behave differently over time. ONS calls its annual dataset a fixed snapshot that does not reflect later corrections. SSA’s files are described as of a stated extract date, so figures for a past birth year in a newer SSA release can differ slightly from the same year in an older one. Record the edition you used for every number, not just the most recent one.
A practical update rule
Here is the update rule we’d build into any international baby name trend methodology covering two countries. Adapt the dates when the agencies announce theirs.
- Stamp every panel with the source edition: “SSA 2025 release (records as of March 2026)” and “ONS 2025 edition (9 July 2026).”
- Refresh on each release, not on a fixed date. When SSA publishes, update the U.S. rows and recalculate shares; do the same for ONS when its edition arrives.
- Mark the gap between releases. Between the U.S. spring release and the England and Wales summer release, one side may be a year ahead. Show “latest available year” per country rather than forcing a shared year that isn’t there yet.
- Re-pull history, don’t append. When a new edition arrives, replace the whole series from that edition, so every year on the chart comes from one extract.
- Re-read the methodology. Check the QMI and SSA background notes for rule changes, such as the 2018 ONS hyphen change, before trusting a long line.
- Keep a change log. One dated line per refresh: what changed, which numbers moved, and whether any conclusion on the dashboard changed with them.
None of this is glamorous. It is what makes a trend chart something another person can trust a year from now. If you’re working through the England and Wales side for the first time, the cluster’s starting guide to ONS 2025 baby name trends is the best place to begin, and if you’re using the data to help decide on a name rather than to publish it, the NameLooks decision framework shows where popularity fits among the other factors.
Questions people actually ask
Can I add SSA and ONS counts together to get an “English-speaking” total?
You can do the arithmetic, but the result has no clear definition. The two counts come from different events (card applications and birth registrations), with different floors (five and three) and different spelling processing. If you need a combined view, show the two countries as separate bands with shares, and let the reader compare them.
Why not compare ranks directly? They’re the easiest thing to find.
Ranks are easy to find because they’re the least informative field. Rank depth depends on population size and how evenly names are spread, so the same rank can represent very different shares in two countries. Use rank as a label and share as the comparison.
Does Wales have separate figures?
The ONS annual workbooks include breakdowns by country within England and Wales, as well as by region of the mother’s usual residence. Use those tables directly rather than estimating Wales from the combined list, and remember that the threshold is defined for England and Wales as a whole.
What about Scotland and Northern Ireland?
They aren’t in the ONS figures. The ONS QMI notes that National Records of Scotland and the Northern Ireland Statistics and Research Agency also produce baby name statistics from birth registration. Treat each as a separate source row with its own documentation, and don’t label an England and Wales figure as “UK”.
Is the U.S. Census 2020 names file a substitute for SSA births data?
No. The Census Bureau’s 2020 names files tabulate first and last names occurring 100 or more times across 2020 Census returns, covering the whole population, not a birth cohort. They answer “how common is this name among people counted in 2020,” which is a different question from “how often was it given in 2025.”
How do I show a name that disappears below the threshold in one year?
Plot the known values and mark the missing year as “below threshold” with the floor written in. Don’t draw a line through zero, and don’t interpolate. The honest statement is that the count was somewhere below five (SSA) or three (ONS) in that area.
Sources and further reading
- SSA: Background information on the baby names data — coverage, the five-occurrence rule, spelling and hyphen treatment, tie rule, the March 2026 extract.
- SSA: Number of Social Security card holders born in the U.S. — the denominators for U.S. shares, by year of birth and sex.
- SSA: Limitations of the names data — top-1,000 forms versus full downloadable files.
- SSA: Change in name popularity — the rule for comparing ranks between two years.
- SSA: Top names over the last 100 years — long-run totals for 1926–2025 and why they differ from single-year ranks.
- SSA press release, May 8, 2026 — the 2025 top ten and the year’s fastest risers.
- ONS: Baby names QMI — registration basis, the fewer-than-three rule, accents, hyphens, cut-off dates, comparability notes.
- ONS: Baby names in England and Wales from 1996 — ranks and counts for 1996 to 2025 in one workbook.
- U.S. Census Bureau: 2020 Census names files — population-wide first and last names occurring 100 or more times, a different question from birth-year data.
NameLooks provides general information for research and decision-making. Name popularity figures describe recorded populations, not individuals, and each agency’s rules and editions can change; check the source before relying on a specific number.