On the Social Security Administration’s list for U.S. births in 2020–2025, the boys’ name at No. 200 is relatively more common than the No. 200 name was in the 1950s. Over the same stretch, the No. 1 name went from roughly 1 boy in 24 to roughly 1 in 89. This page is about that baby name rank vs count gap: what each number says, where a rank alone misleads, and how to turn any rank into a number of babies you can actually decide with.
The short version
- A rank is an order, not an amount. It tells you which name had more babies than which, never how many more. Two ranks next to each other can be a few babies apart or thousands apart.
- No. 1 doesn’t mean what it used to. On SSA’s decade pages, the top boys’ name covered about 4.1% of boys born in the 1950s and about 1.1% of boys born in 2020–2025.
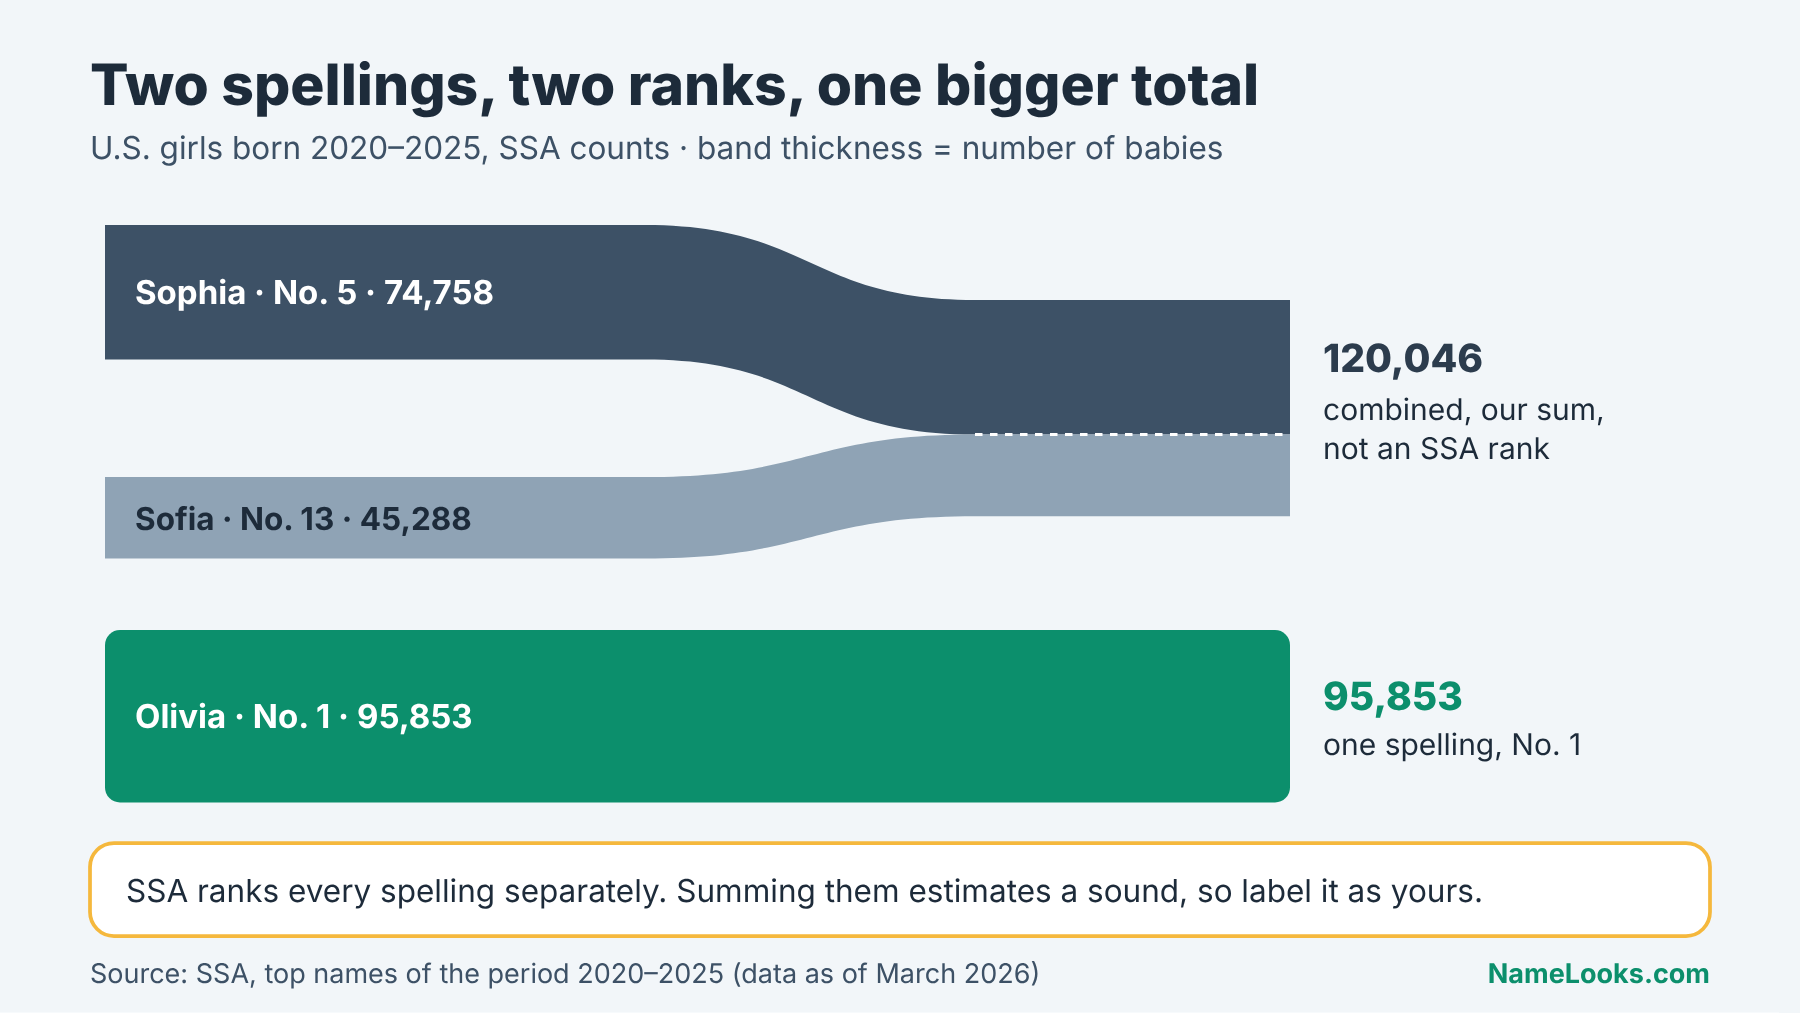
- Each spelling is ranked on its own. SSA never merges Sophia with Sofia or Mateo with Matteo, so the rank of one spelling can badly understate how often a name is heard.
- Share is the fair comparison. Divide a name’s count by the births of that sex in the same period, and you can compare years, decades and boys with girls without the rank playing tricks on you.
- Big rank jumps happen where counts are small. SSA itself notes that the more popular a name, the smaller its change in rank, which is why the “fastest risers” usually sit far down the list.
1A rank tells you order; a count tells you how many babies
If you only read one section, read this one. A baby name rank answers a single question: in this dataset, for this sex and this year, how many names were given to more babies than this one? The count answers a different question: how many babies actually got this exact spelling? And the share, which you calculate yourself, answers the question most parents really care about, which is how likely a child is to share the name with someone else born the same year.
Those three numbers usually move together, which is why the baby name rank vs count distinction gets blurred so easily. They aren’t. The rest of this page shows where they come apart, using figures published on official SSA pages. If you want the broader tour of how to read the national list, our guide to reading the latest SSA rankings is the place to start; this page stays on the single problem of position versus quantity.
What people assume a rank means
Most of us carry a mental picture of a ranking as a ladder with evenly spaced rungs. Climb ten rungs and you’ve climbed the same distance, wherever you started. Baby name lists don’t work like that, and the misunderstanding shapes a lot of naming conversations.
The evenly spaced ladder in our heads
When a relative says a name is “in the top 10,” they usually mean it is everywhere. When a friend says another name is “around No. 300,” they usually mean it is unusual. Both statements assume that rank maps neatly onto how often you’d meet the name. The assumption is reasonable for sports standings, where the gap between first and second is the thing being measured. In name data, the gap is the thing being hidden.
A rank compresses a long, lopsided distribution into a tidy list of integers. That compression is useful for headlines and terrible for judgment. It throws away the size of every gap, and the gaps are where the information lives.
Why the official lists invite the mistake
The SSA’s Popular Baby Names page opens with the top 10 names of the latest year, shown as ranks. That is a sensible design for a public page, and the agency does offer more: its birth-year lookup lets you choose the top 20, 50, 100, 500 or 1,000 names and show them either as a number of births or as a percentage of total births. Most news coverage, though, reprints only the rank order.
The annual announcement follows the same pattern. SSA’s May 2026 press release on 2025’s names lists the top 10 boys and girls and describes the fastest risers by how many places they climbed. It doesn’t print how many babies received any of those names. So the version of the data that reaches most parents is the version with the quantities removed.
What SSA actually publishes, and how a rank is built
Underneath every SSA rank is a count. The rank is derived from the count, not the other way around, and a few rules in between decide which count belongs to which entry.
The three numbers behind every entry
The SSA’s background notes on the baby names data explain that the names come from Social Security card applications for births in the United States, drawn from a 100% sample of those records as of March 2026. For each birth year and each sex, SSA tallies how many applications carry each exact name. Sort those tallies from largest to smallest and you have the ranks.
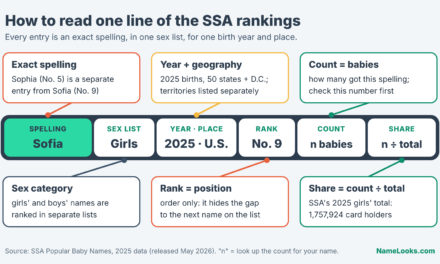
So the raw ingredients are a count (babies with this spelling, this sex, this year) and a rank (its place in the sorted list). The third number, share, is the count divided by all births of that sex in the same year. SSA publishes those totals on its page of U.S. births based on Social Security card applications: for 2025 it lists 1,835,823 boys and 1,757,924 girls.
Rank, count and share in one line each
- Rank: position in a sorted list for one sex and one year (or period). Tells you “more or fewer than.”
- Count: number of babies given that exact spelling. Tells you “how many.”
- Share: count divided by births of that sex in the same period. Tells you “how likely,” and it’s the only one of the three you can compare across years fairly.
Ties, sex categories and the rules in between
Three rules from the SSA background page decide how counts become ranks. First, rankings are done separately for each sex, so the same name can hold one rank on the boys’ list and a different rank on the girls’ list. SSA’s own example is Micah. Second, when two names have the same number of babies in a birth year, SSA breaks the tie alphabetically. Two names with identical counts therefore get different ranks, and the alphabet, not the parents, decides which one sits higher.
Third, spellings are never combined. SSA lists Caitlin, Caitlyn, Kaitlin, Kaitlyn, Kaitlynn, Katelyn and Katelynn as separate names, each with its own rank. Hyphens and spaces are removed before counting, though, so Julie-Anne, Julie Anne and Julieanne become one entry. Those choices are defensible and clearly documented. They also mean a rank is always a rank of a spelling, not of a name as people hear it.
The No. 1 spot across seventy years
The cleanest way to see the gap between rank and count is to hold the rank still and watch the count move. SSA publishes decade pages that list the 200 most popular names of each period with the number of babies given each one, plus the total number of births in the “universe” the names came from. That’s everything you need to turn a rank into a share.

James in the 1950s, Liam in 2020–2025
On the SSA page for popular names of the 1950s, James is No. 1 for boys with 843,768 babies, out of a universe of 20,522,672 boys. That works out to about 4.1% of boys born that decade, or roughly 1 in 24. Mary leads the girls with 625,606 out of 19,735,297, about 3.2%, or roughly 1 in 32.
Now the page for top names of 2020–2025. Liam is No. 1 with 124,842 babies out of 11,136,649 boys, about 1.1%, or roughly 1 in 89. Olivia is No. 1 with 95,853 out of 10,652,963 girls, about 0.9%, or roughly 1 in 111. Same rank, a crowd about a quarter the size in relative terms. SSA notes that the 2020s figures cover six of the decade’s ten years, so treat them as a snapshot rather than a final verdict.
Meanwhile, the middle of the list moved the other way
Here is the counter-intuitive part from the opening. On the same two pages, No. 200 for boys in the 1950s was Kelly, with 13,134 babies, about 1 boy in 1,563. In 2020–2025, No. 200 is Alex, with 11,154 babies out of a much smaller universe, about 1 boy in 998. In relative terms, the 200th name today is more common than the 200th name was seventy years ago.
Read that together with the No. 1 numbers and the shape becomes clear. The top of the distribution has flattened out, and some of those babies have spread into the middle ranks. A rank of 200 now describes a name that’s comparatively more frequent than it once did, while a rank of 1 describes a name that’s comparatively rarer. If you carried a 1950s sense of what “top 10” or “No. 200” means into a 2026 naming decision, you’d misjudge both. For the long-run fashion story behind this, see our look at what a century of top names reveals.
2Why the distance between two ranks is never the same twice
Name frequencies follow a long-tailed shape: a handful of names with very large counts, then a slope that gets gentler and gentler as you go down, then a vast tail of names given to only a few babies each. Ranks slice that curve into equal-looking steps. In number of babies, the steps are anything but equal, and that unevenness is the heart of the baby name rank vs count problem.
Steep at the top, nearly flat further down
The easiest way to feel this is to count the babies standing between two ranks. You can do it with nothing more than the decade pages SSA already publishes.
Counting the babies between two positions
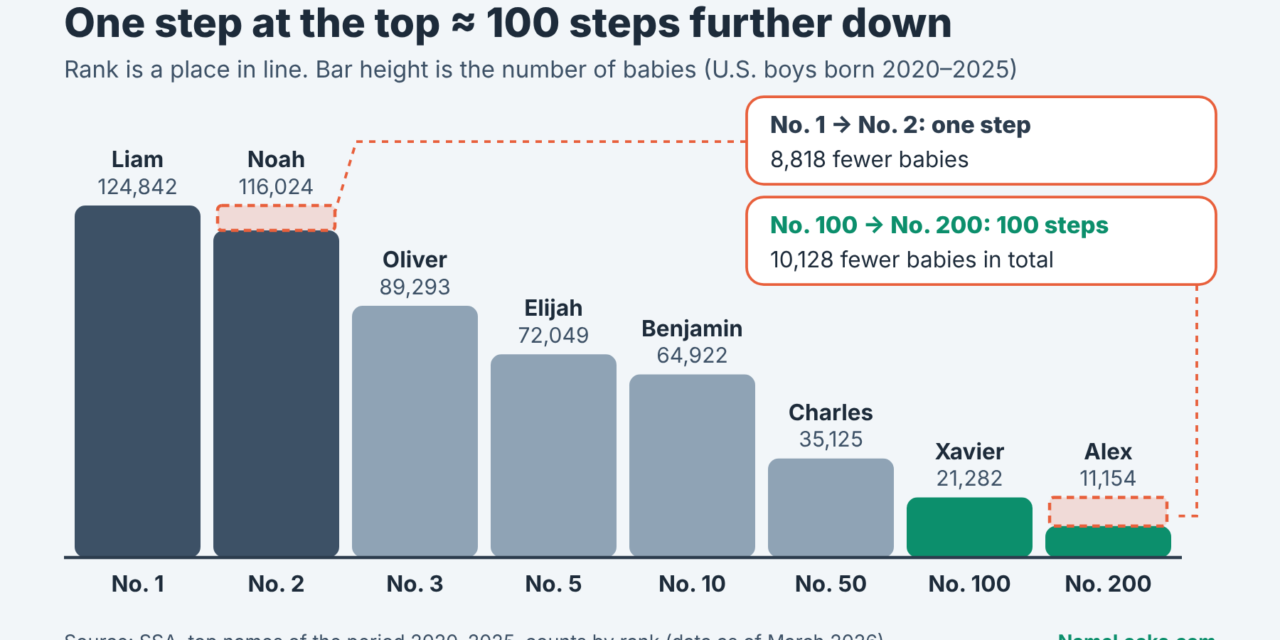
Take the boys on SSA’s 2020–2025 page. Liam at No. 1 has 124,842 babies and Noah at No. 2 has 116,024. One rank, 8,818 babies. Now go down to No. 100, Xavier with 21,282, and No. 200, Alex with 11,154. That’s a hundred ranks and a gap of 10,128 babies, or about 101 babies per rank on average. A single step at the very top is worth roughly as many babies as a hundred steps further down.
The same thing happens in every period. On the 1950s page, James and Michael at Nos. 1 and 2 are only 6,297 babies apart over a whole decade, nearly a tie. Charles at No. 10 has 361,177, less than half of David’s 769,963 at No. 5. So even within the top 10, five ranks could mean “almost identical” or “half as many,” depending on where you stand.
A quick way to sanity-check any rank gap
Whenever someone says one name is “way more popular” because it ranks higher, ask for the two counts and subtract. If you can’t get the counts, at least ask where on the list the two names sit. Ten ranks apart in the top 20 is a real difference. Ten ranks apart around No. 600 can be a rounding error in babies.
SSA’s own note: popular names barely move
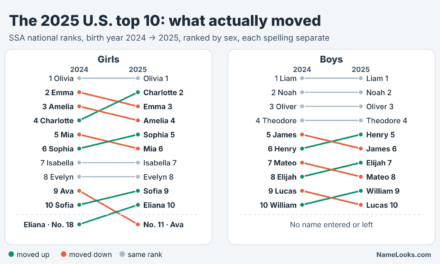
The agency says this plainly on its change in popularity page: “Generally, the more popular a name, the smaller the change in popularity.” That page measures change in ranks between 2024 and 2025, and it only compares names that were in the top 1,000 in at least one of the two years.
The reason is arithmetic, not fashion. Near the top, names are spread far apart in counts, so a name would need thousands of extra babies to pass its neighbor. Far down the list, hundreds of names are packed into a narrow band of counts, so a modest change in babies can carry a name past dozens or hundreds of others. A big rank change near the bottom and a small rank change near the top can represent similar, or even reversed, changes in actual babies.
What a 1,108-place jump can and can’t tell you
Every May, the fastest-rising names get the most attention. They’re fun to read, and they’re also the place where rank misleads most reliably.
Kasai’s climb to No. 639
According to SSA’s 2026 press release, the fastest-rising boys’ name of 2025 was Kasai, which climbed 1,108 places to reach No. 639 and entered the top 1,000 for the first time. Do the subtraction and you get its 2024 position: around No. 1,747. For girls, Associated Press coverage of the same release reported that Klarity rose 1,396 spots into the top 1,000.
Those are real and notable movements. What the rank change doesn’t tell you is how many more babies were behind it. A name moving from the 1,700s into the 600s on the boys’ list is moving through the part of the curve where counts are close together, so a climb that looks enormous in ranks can rest on a fairly modest change in babies. We can’t print Kasai’s counts here because we couldn’t open SSA’s downloadable files in this session; you can look them up yourself in the agency’s “Popularity of a Name” tool.
Reading risers without being fooled
None of this makes rank jumps meaningless. A name entering the top 1,000 for the first time is a genuine signal that more families are choosing it. The trap is reading the size of the jump as the size of the trend. A 1,108-place climb and a 5-place climb near the top are not comparable quantities.
Our article on the fastest-rising names of 2025 covers this year’s risers properly, comparing rank jumps with birth counts name by name. The short rule for this page: when you see a big jump, look up the counts for both years before you treat the name as a wave.
Same rank, different crowd
A rank is relative to its own list, and the boys’ and girls’ lists are different lists. Holding the rank constant while switching sex is one of the simplest ways to see why positions aren’t portable.
Boys and girls at the same position
On SSA’s 2020–2025 page, No. 10 for boys is Benjamin with 64,922 babies, about 1 in 172 boys. No. 10 for girls is Harper with 47,509, about 1 in 224 girls. Same rank, meaningfully different odds of meeting a namesake. At No. 100 the pattern holds: Xavier with 21,282 (about 1 in 523) against Serenity with 16,483 (about 1 in 646).
It doesn’t always run the same direction, which is exactly the point. On the SSA page for the 2010s, Emma at No. 1 for girls had 195,070 babies, about 1 in 98, while Noah at No. 1 for boys had 183,378, about 1 in 110. In that decade the top girls’ name was the more concentrated of the two. In 2020–2025, the top boys’ name is. You can only see that with counts and totals in hand.

Why the top 1,000 covers more boys than girls
SSA’s page on the limits of the baby names data gives one more piece of the explanation. For U.S. births in 2025, the top 1,000 names account for about 75.6% of boys’ names and about 67.3% of girls’ names, or about 71.5% overall. Put the other way, roughly one boy in four and roughly one girl in three received a name outside the top 1,000.
That difference means girls’ names are spread across more distinct entries, so each rank on the girls’ list tends to hold fewer babies than the same rank on the boys’ list. It also means a girls’ name at No. 900 and a boys’ name at No. 900 are not equally “rare.” The same SSA table shows that coverage has slipped slightly since 2016, when the top 1,000 covered 73.25% of all names. The list is very slowly getting less concentrated, which nudges every rank’s meaning a little further each year.
3Spelling, sex, year and place: the confounders hiding inside a rank
Even when you have counts, a single entry on the SSA list can mislead you about how often a name is actually heard. Four design choices in the data do most of the damage: spellings are separate, sexes are separate, years differ in size, and small numbers are suppressed. None of these are flaws, exactly. They’re the price of a clean, consistent dataset. You just have to know which question each one quietly changes, because each can widen the baby name rank vs count gap in its own way.
Each spelling is its own entry
This is the confounder that catches parents most often, because the way a name sounds on a playground has nothing to do with how it is spelled on a card application.
Sophia and Sofia, two periods, two stories
On SSA’s 2010s page, Emma is No. 1 for girls with 195,070 babies. Sophia is No. 3 with 181,174 and Sofia is No. 18 with 82,402. Add the two spellings and you get 263,576, comfortably more than Emma. On the 2020–2025 page, Olivia leads with 95,853; Sophia sits at No. 5 with 74,758 and Sofia at No. 13 with 45,288, which together make 120,046.
The boys’ list has its own version. For 2020–2025, Mateo is No. 11 with 62,272 and Matteo is No. 155 with 14,188. Together they total 76,460, more than Henry at No. 7 with 68,047. If you’re judging how many classmates might answer to a name, the rank of one spelling can be off by a wide margin. NameLooks has a full page on Sophia and Sofia as separate variants if that pair is on your list.
What combining would and wouldn’t tell you
Adding spellings together is a reasonable estimate of how often a sound is used, but it’s your estimate, not SSA’s. The agency publishes no pronunciation data, so it can’t confirm that every family with one spelling says the name the same way as every family with the other. Some spelling pairs are pronounced alike by most people; others are not, and the data won’t tell you which.
So label what you did. “Sophia and Sofia together account for 120,046 girls born in 2020–2025 (SSA, our sum of two separate entries)” is honest. “Sophia is the No. 1 girls’ name” is not, because no official ranking says so. The same caution applies to Isabella, Isabelle and Izabella, which SSA’s 2010s page ranks at Nos. 4, 105 and 200. Whether they belong in one bucket depends on what you’re asking.
Year, cohort size and the length of the window
A count is only meaningful next to the total it came from. Births in the United States have not been constant, and SSA’s lists come in single-year and multi-year versions that behave differently.
Fewer babies overall changes what a count means
SSA’s births table shows 4,332,400 Social Security card applicants born in 2007 and 3,593,747 born in 2025, a drop of about 17%. That matters for anyone comparing counts across years. A name given to the same number of babies in 2007 and in 2025 would hold a larger share of the 2025 cohort, simply because the cohort shrank.
Picture a hypothetical name that’s given to 2,000 boys in both years. Its count is flat, its share has risen, and its rank could have gone almost anywhere depending on what every other name did. Three numbers, three different stories about the “same” result. When you compare years, compare shares, and say which you used. Our piece on what changed in the 2025 U.S. rankings applies that discipline to this year’s top names.
Decade lists and single-year lists aren’t interchangeable
SSA’s decade pages rank names by their total over the whole period, which smooths out short spikes. Noah is No. 1 for boys on the 2010s page even though Liam held the top spot in the single years 2017, 2018 and 2019, according to SSA’s table of top five names by year. Neither list is wrong; they answer different questions.
A single-year rank tells you about one cohort. A multi-year count tells you about a group of children who will overlap in school, sports and later in workplaces. For that second question, the multi-year total is usually the better guide. We walk through it in the 2020–2025 counts article, which argues for using several years of data instead of the latest headline.
Geography and the privacy floor
National ranks describe the whole country. Your child will grow up somewhere specific, and the published data gets thinner the smaller the area you look at.
National rank versus the state you live in
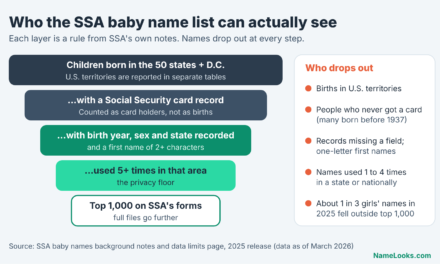
SSA publishes state lists alongside the national one, and a name’s state rank can differ a lot from its national rank. National data covers the 50 states and the District of Columbia; Puerto Rico and the other territories are reported separately and aren’t part of the national totals, according to the background notes. If you live in a territory, the national list isn’t describing your local births at all.
State-level comparisons have their own traps, since states differ enormously in how many babies are born. A modest count can produce a high rank in a small state. Our page on when national rank hides regional differences covers how to read state lists without overreading them.
The five-baby threshold and what disappears below it
To protect privacy, SSA excludes names with fewer than five occurrences in any geographic area. The background page notes the consequence directly: if a name has fewer than five births in a state in a given year, that state’s figures won’t add up to the national count. Names below the threshold simply aren’t in the files, so you can’t rank or count them at all from public data.
That has a practical effect on rank. A name ranked in the 2,000s nationally might be shared by only a handful of babies, yet every one of those babies is counted, while thousands of truly rare names sit below the floor and are invisible. The full rundown of what the SSA dataset cannot tell you covers this threshold alongside the other blind spots, and our article on names just outside the top 1000 looks at the zone where ranks thin out.
| Claim you might want to make | Source / dataset | Geography | Year(s) | Metric | Limitation | Editorial takeaway |
|---|---|---|---|---|---|---|
| “The No. 1 name is far less dominant than it used to be” | SSA decade pages (1950s, 2020–2025) | U.S. (50 states + D.C.) | 1950–59 vs 2020–25 | Count ÷ universe = share | 2020s page covers 6 of 10 years | Supported: about 4.1% vs about 1.1% of boys |
| “Ranks are evenly spaced” | SSA 2020–2025 page | U.S. | 2020–25 | Count gaps between ranks | Only ranks 1–200 published on that page | Not supported: the step from No. 1 to No. 2 (8,818 boys) nearly equals the 100 steps from No. 100 to No. 200 (10,128) |
| “A spelling’s rank shows how common the name sounds” | SSA 2010s and 2020–2025 pages; background notes | U.S. | 2010–19, 2020–25 | Separate counts per spelling | No pronunciation data; summing is your estimate | Misleading for split spellings such as Sophia/Sofia |
| “Same rank means same frequency for boys and girls” | SSA 2020–2025 page; limits page | U.S. | 2020–25; 2025 | Share at equal rank; top-1000 coverage | Coverage figures are for all names, not per rank | Not supported: No. 10 is about 1 in 172 boys vs 1 in 224 girls |
| “Big rank jumps mean big trends” | SSA change-in-popularity page; 2026 release | U.S. | 2024 → 2025 | Change in rank | Release gives places climbed, not counts | Check counts first; SSA says popular names move less |
| “This name is rare where I live” | SSA state data; background notes | Individual states | Any year | State rank and count | Fewer than 5 births not published | Possible, but small states and the privacy floor limit what you can say |
4Turn any rank into a number you can actually use
Settling a baby name rank vs count question doesn’t take a statistics degree. You need the count, the matching total, a calculator and about ten minutes. The method below works for any U.S. name on the SSA lists, and the worked examples after it use only figures SSA publishes on its own pages.
A five-step conversion from rank to share and number of babies
The order matters. Each step fixes a specific way that a bare rank can fool you, so skipping one tends to bring back the problem it was meant to solve.
Steps 1–3: get the count, get the total, divide
- Pin down the exact entry. Write down the spelling, the sex category and the year or period. “Sofia, girls, 2025” is an entry. “Sofia” on its own isn’t, and neither is “around 2020.”
- Find the count, not just the rank. On SSA’s birth-year lookup, choose the option that shows the number of births rather than only the rank. For multi-year questions, the decade pages already print counts next to each rank.
- Divide by births of the same sex and period. For one year, use SSA’s births table (for 2025, 1,835,823 boys and 1,757,924 girls). For a decade page, use the “universe” figure printed at the top of that page. Turn the result into “about 1 in N” by dividing the total by the count; most people find that easier to picture than a percentage.
If you’d rather skip the arithmetic for single years, SSA’s lookup can show names as a percentage of total births directly. That percentage is the share. Just make sure you know which total it’s based on before you compare it with a number you calculated yourself from a different table.
Steps 4–5: add the spellings, then read the trend
- Look up the spellings you’d count as “the same name.” Do it on purpose, list them, and keep your own sum separate from SSA’s separate entries. Decide in advance which question you’re asking: one about a spelling (for forms, monograms and search results) or one about a sound (for classrooms and sports teams).
- Repeat for several years. A share that’s been flat for a decade means something different from the same share after a sudden climb. SSA’s “Popularity of a Name” tool shows a name’s history year by year, and our page on how SSA birth-year counts and separate sex categories work explains what changes between years.
Two easy mistakes in the arithmetic
First, dividing a single-year count by a decade total, or a boys’ count by all births. Always match sex and period. Second, treating SSA’s births table as the official birth count of the United States. It counts U.S.-born Social Security card applicants with a known birth year, sex and state of birth, which SSA describes on that page. It’s the right denominator for SSA’s name counts, and that’s all you need it for here.
Worked examples using SSA’s own figures
These examples use real counts from SSA’s 2020–2025 page. They’re here to show the method, not to recommend or discourage any name. All shares are our calculations from SSA’s counts and the totals printed on the same page.
Two ranks apart and practically the same
Theodore is No. 9 for boys in 2020–2025, with 65,579 babies. Mateo is No. 11, with 62,272. The rank gap sounds tidy. In shares, Theodore is about 0.59% of boys born in that window (roughly 1 in 170) and Mateo about 0.56% (roughly 1 in 179). For any practical purpose, such as the chance of two in one classroom, those are the same level of popularity.
Now add the second spelling, as in Step 4. Matteo is No. 155 with 14,188 babies. If your family hears Mateo and Matteo as one name, the combined 76,460 boys put that sound ahead of Theodore, Henry and Elijah, even though neither spelling ranks above any of them. Rank had the order right for the spellings and wrong for the sound.
A hundred ranks apart and only half as common
Xavier at No. 100 had 21,282 babies in 2020–2025, about 1 boy in 523. Alex at No. 200 had 11,154, about 1 in 998. A hundred places down the list, and the name is only about half as frequent. Compare that with the top of the same list: from Liam at No. 1 (about 1 in 89) to Benjamin at No. 10 (about 1 in 172), the frequency also roughly halves, in just nine places.
If it helps to picture it, imagine 1,000 boys born in 2020–2025 chosen at random from across the country. On average you’d expect about 11 Liams, about 2 Xaviers and about 1 Alex. Real classrooms aren’t random national samples, so treat that as a sense of scale rather than a forecast for your local school. For the decision side of how much namesake overlap you’re comfortable with, our page on how much uniqueness you actually want picks up the thread.
| Period and rank | Boys: name and count | Boys: about 1 in | Girls: name and count | Girls: about 1 in | Caveat | Naming implication |
|---|---|---|---|---|---|---|
| 1950s, No. 1 | James, 843,768 | 24 | Mary, 625,606 | 32 | Counts are card applications on file as of March 2026 | “No. 1” once meant a truly crowded name |
| 2000s, No. 1 | Jacob, 274,077 | 78 | Emily, 223,768 | 91 | Decade totals hide year-to-year swings | The top spot was already far less dominant |
| 2010s, No. 1 | Noah, 183,378 | 110 | Emma, 195,070 | 98 | Decade rank differs from some single-year ranks | Which sex has the more concentrated top name can flip |
| 2020–2025, No. 1 | Liam, 124,842 | 89 | Olivia, 95,853 | 111 | Six of ten years; SSA calls it a rough indication | Today’s top name is shared, not ubiquitous |
| 1950s, No. 200 | Kelly, 13,134 | 1,563 | Grace, 15,929 | 1,239 | Only the top 200 are on decade pages | Mid-list names were relatively scarce |
| 2020–2025, No. 200 | Alex, 11,154 | 998 | Lilah, 8,801 | 1,210 | Spelling variants listed separately | A boys’ No. 200 is now relatively more common than in the 1950s |
Sources for every count and total in that table: SSA’s decade pages for the 1950s, 2000s, 2010s and 2020–2025, each based on Social Security card application data as of March 2026. The “1 in” figures are the page’s universe for that sex divided by the name’s count, rounded.
5Using baby name rank vs count in a real naming decision
All of this is only worth knowing if it changes how you decide. For most families it changes one thing: you stop reacting to a position on a list and start reacting to the likely number of namesakes, which is what you were worried about in the first place. What follows separates what the evidence supports from what stays a matter of taste.
Reasonable takeaways the data supports
The SSA figures support a few conclusions firmly. They support a few others only loosely, and it helps to know which is which before you bring numbers into a family conversation.
When a rank is good enough on its own
Rank is fine for coarse sorting. If a name is in the top 10 for its sex in the latest year, it’s common by any reasonable measure, and you don’t need a share to know that. If a spelling doesn’t appear in the top 1,000 at all, it went to a small number of babies nationally, even if you can’t say exactly how small without the full files.
Rank is also fine for comparing two spellings or names within the same list, the same sex and the same year, as long as all you want is “which one had more.” The order is accurate. It’s the distance that rank can’t give you.
When you need the count, the share or the number of babies
You need counts the moment your question involves “how much.” How much more common is our first choice than our second? How likely is a namesake in a class? Did this name really grow, or did other names just fall around it? Has the name changed since we were kids? Each of those depends on the gaps a rank hides.
You also need counts whenever you compare across lists: boys with girls, one year with another, a decade with a single year, one state with the nation. A rank only has meaning inside its own list. The moment you set two lists side by side, convert to shares or you’ll be comparing positions in two differently shaped queues. If you’re working through a full decision, the overall naming framework shows where popularity fits among the other factors.

What remains subjective or uncertain
Data can make a vague worry precise. It can’t decide for you how much that precise number should matter, and there are things the national files simply don’t contain.
Your child’s real crowd isn’t in the data
Every share on this page is a national average for U.S.-born card applicants. Your child’s world is a school, a neighborhood, a set of friends and family. Names cluster by region and community, so a name with a national share of about 1 in 500 could be much more frequent, or much less, in the place you actually live. SSA’s state lists help a little, but no public dataset shows names by school district or zip code.
The data also stops at birth. It tells you what parents chose for babies born in a year. It says nothing about nicknames, middle names used as first names, or how many of those children later go by something else. None of that makes the counts useless. It just means a count is the start of an estimate, not a guarantee about any individual child.
How a number feels is personal
Two families can look at “about 1 in 170 boys” and reach opposite conclusions. One hears “comfortably familiar,” the other hears “there’ll be one in every grade.” Neither is misreading the data. They value different things, and that’s a preference, not a statistical question.
What the numbers can do is stop the conversation from running on false premises. If one partner objects to a name because it’s “top 10” and the other likes it because it “isn’t that common,” the counts often show they’re both partly right and arguing about the same level of popularity. Once that’s on the table, the real discussion, about sound, family meaning or fit with a surname, can start.
What to say when someone quotes a rank at you
Rank comes up in naming conversations constantly, often as a conversation-ender. A couple of plain, friendly responses can turn it back into information.
“It’s No. 3, every class will have one”
Try something like: “It is near the top, but let me check how many that actually is.” Then look up the count and the share. For 2020–2025, the No. 3 boys’ name on SSA’s page, Oliver, had 89,293 babies, about 1 in 125 boys. That’s a common name. It’s also a long way from the 1950s, when No. 3 on SSA’s decade page, Robert, had 830,395 babies out of about 20.5 million boys, roughly 1 in 25.
Whether 1 in 125 is “too common” is still your call. But you’re now deciding about a real number instead of a word that meant something very different when the person quoting it was born. Our article on why seven years at No. 1 doesn’t mean naming has stopped changing is a good one to share with the relative who remembers when every class had four of the same name.
“It’s not even in the top 500, nobody’s heard of it”
Here the useful reply is: “It’s not in the top 500 as this spelling. Let me check the others.” Unranked or low-ranked spellings sometimes belong to names that are familiar once you add the variants, as the Sofia and Matteo examples above show. And a name outside the top 1,000 can still be one people recognize from other generations, other countries or other languages, none of which a single-year U.S. rank captures.
The opposite can be true too. A spelling at No. 450 might be the only common spelling of a name that really is uncommon. The rank alone can’t tell you which situation you’re in. The count, the spellings and a few years of history can. For a complete walk through the national list itself, go back to our cornerstone on the most popular baby names in the U.S.
Questions people actually ask
Can two names share the same SSA rank?
No. When two names have exactly the same number of babies for one sex in one birth year, SSA breaks the tie alphabetically, so each gets its own rank. That means a one-place difference can reflect zero difference in babies. It’s one more reason to look at counts before treating neighboring ranks as meaningfully different.
Is the “percent of total births” option on SSA’s site the same as share?
Yes, in the sense used on this page: it expresses a name’s count as a percentage of births in the same group. The detail to watch is which total it’s based on. If you calculate a share yourself from a decade page, use that page’s printed universe for the same sex, and don’t mix it with single-year percentages from the lookup tool.
Why can a name’s rank change when its count barely moves?
Because a rank depends on every other name on the list. If several neighbors gain babies and yours stays flat, your rank falls; if they lose babies, yours rises without any change of your own. Shifts like that are most common far down the list, where many names have similar counts, so a quiet year for the neighbors can move a name dozens of places.
Does a girls’ rank include boys with the same name?
No. SSA ranks each sex separately, so a name used for both boys and girls has two separate counts and two separate ranks. If you search a name on SSA’s site without choosing a sex, the background notes say it shows the more popular name-and-sex combination. To understand total use of a name across both lists, you’d need both counts, and you’d still be relying on the sex recorded on the application, which SSA notes isn’t edited.
Do SSA’s counts for a year ever change after they’re published?
SSA describes each set of figures as based on its card application records as of a particular date, currently March 2026. Because the snapshot date moves with each release, figures for the same birth year can differ slightly between releases. When you quote a count, name the release you used so a reader can reproduce it.
Is there a rule of thumb for baby name rank vs count?
Roughly: the higher a name sits, the more babies each single rank step represents. On SSA’s 2020–2025 boys’ list, the step from No. 1 to No. 2 was 8,818 babies, while the hundred steps from No. 100 to No. 200 added up to 10,128. So treat small rank differences near the top as real, and treat differences of dozens of places in the middle or lower list as possibly trivial until you’ve seen the counts.
Where can I find counts for names beyond the top 1,000?
SSA’s lookup forms show only the top 1,000 names per year, but the agency’s limits page says it provides almost all names, in downloadable national, state and territory files, for people researching naming trends. Anything with fewer than five occurrences in a geographic area is excluded for privacy, so the truly rarest names never appear in public data.
Sources and further reading
- SSA Popular Baby Names — the official home of U.S. name data, with the birth-year lookup that can show counts or percentages instead of ranks.
- SSA background information — how names are tabulated: separate spellings, separate sexes, alphabetical tie-breaks, the five-occurrence rule.
- SSA number of U.S. births by year — the denominators you need to turn any single-year count into a share.
- SSA limitations of the data — how much of each year’s births the top 1,000 names cover, by sex, 2016–2025.
- SSA change in popularity — the 2024-to-2025 rank-change tables and SSA’s note that popular names change least.
- SSA top five names, 1926–2025 — quick reference for which names led each year.
- SSA popular names of the 1950s, 2000s, 2010s and 2020–2025 — top 200 names with counts and the total births behind them, the raw material for this page’s shares.
- SSA press release, May 8, 2026 — the official announcement of 2025’s top names and fastest risers.
NameLooks provides general information about names and naming data. Popularity figures describe populations of U.S.-born Social Security card applicants, not any individual child, and shares on this page are our own calculations from SSA’s published counts.