Picture a grandmother named Linda holding a newborn granddaughter named Evelyn, and someone at the party saying, “See? Names come back every hundred years.” It’s a nice line, and it’s half true. This page reads baby name trends 100 years deep in the Social Security Administration’s own tables, 1926 through 2025, to show which fashion cycles the record actually supports, which ones it doesn’t, and how to use a century of rankings without being fooled by them.
The short version
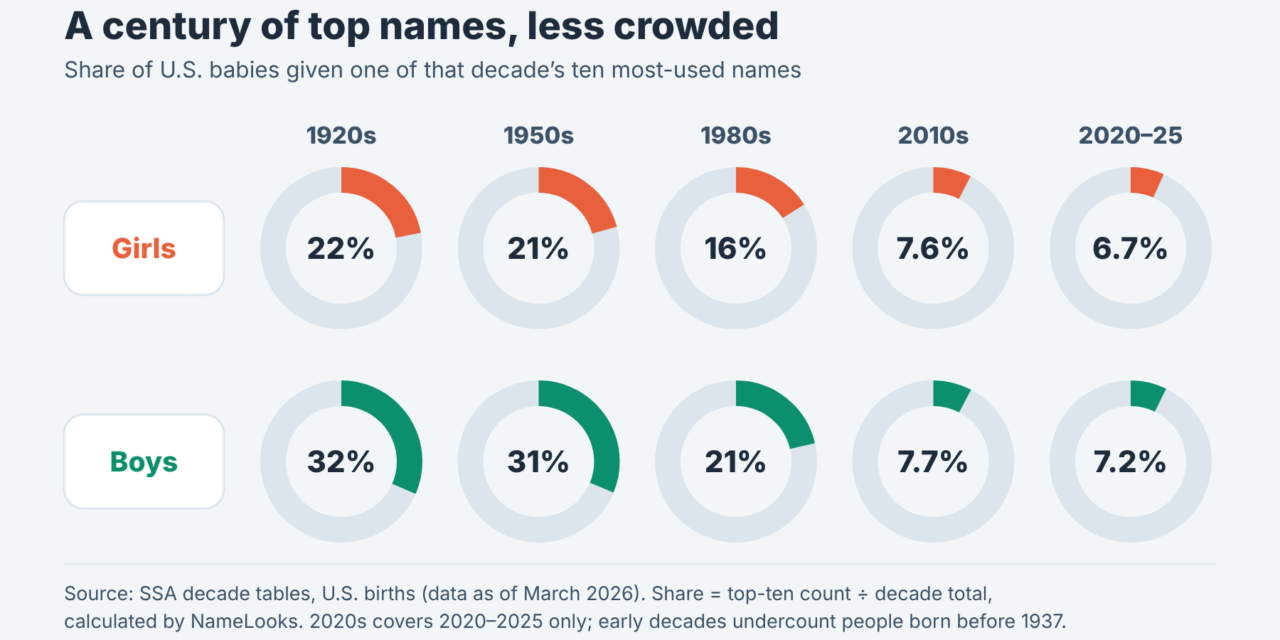
- The biggest change isn’t which name is No. 1. It’s how little No. 1 now means. By our arithmetic from SSA decade tables, the ten most-used girls’ names covered about 22% of girls in the 1920s and under 7% in 2020–2025. For boys it fell from about 31% to about 7%.
- Girls’ top names turn over faster. In SSA’s year-by-year No. 1 list, four different girls’ names held the top spot from 1926 to 1975, and eight did from 1976 to 2025. The boys’ count was four in each half.
- “Names come back after a century” works for some names and fails for many. Evelyn, Henry, Theodore and Charlotte returned to the top ten; Dorothy, Helen and Betty, three of the top four girls’ names of the 1920s, aren’t in the 2020–2025 top 200.
- Speed is a warning sign. Published research on more than a century of U.S. and French name data found that names adopted quickly tended to be abandoned quickly.
- Every comparison across a century has to say rank, count or share. A No. 1 name in 1926 and a No. 1 name in 2025 are different sizes, and SSA counts each spelling as its own name.
1What a century of U.S. top names actually shows
Here’s the core answer up front. SSA’s long-run rankings don’t show a tidy wheel where every name rolls back around on schedule. They show three things at once: a steady loosening of the top of the chart, waves of individual names that rise and fall over a few decades, and a smaller set of names that return after skipping two or three generations. The useful skill is telling those three apart.
Everything on this page comes from SSA’s public baby-name pages, which are built from Social Security card applications for U.S. births. If you’re new to how those rankings are put together, the cluster’s main guide to reading the latest SSA rankings covers the basics; here we stay on the long view.
The assumption: fashion runs in a neat 100-year loop
The folk version of name history goes like this. Parents avoid the names of their own parents’ generation because those names feel middle-aged. They’re more open to their grandparents’ or great-grandparents’ names, which feel old enough to be charming. So names fall out, wait about a century, and come back.
It’s a reasonable story about taste. The trouble is that people tend to remember the names that did come back and forget the much longer list that didn’t. That’s survivorship in its purest form.
Where the rule of thumb comes from
Nobody needs a dataset to notice that a baby named Hazel or Theodore sounds like a great-grandparent. The rule spreads because the examples are vivid and current: you hear the revived names on playgrounds, and you never hear the ones that stayed away. No official source states a 100-year rule, and SSA doesn’t claim one. It’s a pattern people infer, not one the agency publishes.
Sociologists who study names have long argued that fashion has internal momentum of its own. Stanley Lieberson’s A Matter of Taste (Yale University Press, 2000) is the classic treatment; as Cleveland Kent Evans summarized it in a 2002 review in the journal Names, Lieberson warned that it is “treacherous to casually use an external social development to explain an observed change in fashion.” That caution applies to the 100-year rule too. A neat cycle is an explanation looking for data.
A quick test against SSA’s decade tables
You can test the rule in ten minutes. SSA publishes a top-200 table for each decade, from the 1880s to the current partial decade. Take the top ten girls’ names of the 1920s and look each one up in the 2020s table, which currently covers births from 2020 to 2025.
When we did that with the tables as of SSA’s March 2026 data, three of the ten were in the 2020–2025 top 200: Mary (rank 132), Margaret (126) and Ruth (187). Dorothy, Helen, Betty, Virginia, Doris, Mildred and Frances were not. For boys, seven of the 1920s top ten were still in the top 200: James (4), William (6), John (21), Joseph (28), Charles (50), Robert (85) and George (134). Richard, Edward and Donald were not. If names reliably came back after a century, those numbers would look very different.
A note on “the 2020s”
SSA’s 2020s page covers only 2020–2025, six years of a ten-year decade. The agency itself says those rankings are “a rough indication” of the final decade. Treat any 2020s figure on this page as a partial-decade snapshot.
Five patterns in the century record
Once you stop looking for a loop, the record gets more interesting. Reading SSA’s top five names for every year from 1926 to 2025 next to the decade tables, five patterns stand out. Each is stated with its dataset and metric, because each one changes depending on whether you look at rank, count or share.
Pattern 1: The top of the chart got far less crowded
In the 1920s decade table, Mary accounts for 701,755 of the 12,402,259 girls in SSA’s universe for that decade. That’s about 5.7% of girls, by our division of SSA’s two published numbers. In the 2020–2025 table, Olivia, the top girls’ name, accounts for 95,853 of 10,652,963 girls, about 0.9%. The boys’ story is the same shape: Robert covered about 5.1% of boys in the 1920s, and Liam about 1.1% in 2020–2025.
The top ten tells it more starkly. Add up the ten most-used girls’ names in each decade table and divide by the decade’s total, and you get roughly 21.9% for the 1920s, 20.7% for the 1950s, 15.9% for the 1980s, 7.6% for the 2010s and 6.7% for 2020–2025. For boys: 31.5%, 31.2%, 21.3%, 7.7% and 7.2%. Those are shares we calculated, not figures SSA prints, but every input is on SSA’s pages.
So when someone says a name is “No. 1,” the century view asks: No. 1 out of how crowded a field? SSA’s own “beyond the top 1000” page makes a related point for recent years: in 2025, the top 1,000 names covered 75.59% of boys and 67.25% of girls, so roughly a quarter to a third of babies got a name outside the published top 1,000.

Pattern 2: Girls’ number-one names change hands more often
SSA’s top-five page lists the No. 1 name for each sex in every year from 1926 to 2025. Counting the distinct names in each half of the century gives a clean comparison. From 1926 to 1975, four girls’ names held No. 1: Mary, Linda, Lisa and Jennifer. From 1976 to 2025, eight did: Jennifer, Jessica, Ashley, Emily, Emma, Isabella, Sophia and Olivia.
The boys’ side barely changed pace. Robert, James, Michael and David held No. 1 in the first half; Michael, Jacob, Noah and Liam in the second. SSA notes on the same page that Michael was No. 1 in 44 of the 100 years and Mary in 30. No girls’ name since Mary has come close to that kind of reign, and Olivia’s current run, seven straight years through 2025, is long by modern standards and short by Michael’s.
Pattern 3: Boys’ names hold their ground longer
Pattern 2 hints at this, and the decade tables confirm it. James sits at rank 3, 2, 1, 1, 4, 5, 6, 13, 17, 9 and 4 in the eleven decade tables from the 1920s through 2020–2025. It never falls below 17th. No girls’ name in our checks shows anything like that steadiness: Mary, the century’s dominant girls’ name, slides from No. 1 in the 1950s to 132nd in 2020–2025.
This is a description of the data, not an explanation. Families may treat boys’ names as more tied to inherited, repeated patterns, or there may be other reasons; SSA’s tables can’t tell you why. They only tell you that, over this century, a boys’ name at the top was more likely to still be near the top a generation later.
Pattern 4: Some names do come back, selectively
The revival story isn’t wrong; it’s narrow. Evelyn was 12th in the 1920s girls’ table, slid to 112th in the 1950s, dropped out of the top 200 in the 1970s and 1980s, and was 9th in 2020–2025. Charlotte, 78th in the 1920s, missed the top 200 in the 1970s, 1980s and 1990s, then reached 3rd in 2020–2025. Henry and Theodore made the same kind of trip on the boys’ side.
Those returns are real. So are the non-returns of Dorothy, Helen and Betty, and the fact that Linda, the No. 2 girls’ name of both the 1940s and the 1950s, doesn’t appear in the top 200 for the 2010s or 2020–2025. The cluster’s sibling page on comparing names that peaked 100 years ago with the 2020s works through those pairings name by name; the takeaway here is that a century gap makes a return possible, not likely.
Pattern 5: Names that rise fast tend to fall fast
This is the pattern with the strongest research behind it. Jonah Berger and Gaël Le Mens, writing in the Proceedings of the National Academy of Sciences in 2009, analyzed more than 100 years of first-name data from France and the United States. Their abstract reports that names adopted quickly tended to be abandoned faster, and that quickly adopted names also reached lower cumulative adoption.
The decade tables show the shape plainly. Linda doesn’t appear in the 1920s top 200, is 89th in the 1930s, and is 2nd in the 1940s and 1950s. By the 1980s it’s 128th. Jennifer goes from 98th in the 1950s to 20th in the 1960s and 1st in the 1970s, then out of the top 200 by the 2010s. A steep climb and a steep slide are often two halves of the same story.
| Claim | Source / dataset | Geography | Years | Metric | Limitation | Editorial takeaway |
|---|---|---|---|---|---|---|
| The top names now cover a much smaller share of babies | SSA decade tables (top 200 per decade) | U.S., 50 states + D.C. | 1920s, 1950s, 1980s, 2010s, 2020–2025 | Share, calculated by us from SSA counts and decade totals | Early decades undercounted; 2020s is a partial decade | A modern No. 1 name is far less “everywhere” than a 1950s No. 1 |
| Girls’ No. 1 changes hands more often than boys’ | SSA top five names by year | U.S. | 1926–2025 | Rank (No. 1 only) | Counts distinct No. 1 names, not how close the race was | Expect more churn near the top of girls’ lists |
| Michael was No. 1 in 44 years; Mary in 30 | SSA top five page note | U.S. | 1926–2025 | Rank | Single spelling; says nothing about counts | Long reigns happened in a more concentrated era |
| Some names return after skipping generations | SSA decade tables | U.S. | 1920s–2020s | Decade rank | Top 200 only; a name “absent” may still be in use | A return is possible, not predictable |
| Fast adoption predicts fast abandonment | Berger & Le Mens, PNAS 2009 | U.S. and France | 100+ years | Name frequency over time | Population tendency; can’t forecast one name | Check the slope, not only the level |
| Name frequencies follow a stable skewed distribution consistent with random copying | Hahn & Bentley, Proc. R. Soc. B 2003 | U.S. | Each decade of the 20th century | Frequency distribution | A baseline model, not a full explanation | Some popularity needs no special cause |
2Before you compare 1926 with 2025, check what changed besides taste
Any reading of baby name trends 100 years apart is only as good as the assumption that the two ends were measured the same way. With SSA data, they mostly were, but “mostly” hides a few traps that matter far more over a century than over a year or two. This section covers the ones that change conclusions. The full catalogue of the dataset’s quirks belongs to our page on what SSA’s baby-name data cannot tell you; here we focus on the ones that bend long-run trends.
Who is in the data, and from which years
SSA’s background page says the names come from a 100% sample of Social Security card applications for U.S. births after 1879, as of March 2026. National figures cover the 50 states and the District of Columbia; Puerto Rico and the other territories are published separately and are not in the national totals. Records need a year of birth, sex and state of birth to be counted.
That’s a strong foundation. It’s also a foundation built from an administrative process that changed over the century, which is the first thing to keep in mind when you set the 1920s beside the 2020s.
The pre-1937 coverage gap
People born in the 1920s were not issued cards at birth the way most babies are today, so they only show up in the files if they applied for a card at some later point in life. SSA says plainly that “many people born before 1937 never applied for a Social Security card,” and their names are missing. The early end of any century comparison therefore describes the people who later applied, not every baby born.
You can see a symptom of this in the decade totals. In the 1920s table, SSA’s universe has 12,402,259 girls and 11,372,758 boys; the 1930s table also has more girls than boys. From the 1940s table onward, boys outnumber girls in every decade. SSA’s page doesn’t explain that flip, and we won’t guess at the cause. What it tells you is that the early totals are shaped by who ended up in the records.
Three tools that look alike but answer different questions
SSA offers three century-scale views, and mixing them up causes most long-run errors.
- The top five by year (1926–2025) shows the five leading names for each sex in each birth year. Good for reigns and turnover at the very top; useless for anything below fifth place.
- The decade tables rank the top 200 names per decade by total occurrences across the decade. SSA says decade popularity is determined “the same way” as a single year, just summed over ten years. Good for shapes; blind below rank 200.
- The top names over the last 100 years sums all births from 1926 to 2025 into one ranking. Good for “which names were used most overall”; it flattens every cycle into a single total.
That last table is worth a moment because it tells a different story from the yearly charts. James leads the boys with 4,505,076 occurrences out of 180,126,408 boys, about 2.5%. Mary leads the girls with 2,845,637 out of 174,147,370, about 1.6%. Michael was No. 1 in far more individual years than James, yet James has the larger 100-year total, because it was large and steady for longer. A reign and a lifetime total are different achievements.
Rank, count and share across a century
This is the single most important habit for long-run reading. Rank tells you position. Count tells you how many babies. Share tells you what fraction of the relevant group got the name. Over one year, rank and count move together closely enough that people get away with blurring them. Over a hundred years, they come apart completely.
Why a No. 1 in 1926 and a No. 1 in 2025 aren’t the same size
Two forces stretch the gap. The number of births in SSA’s universe changes from decade to decade, so the same count means a different share. And the spread of names widens, so the leader can hold the top rank with a far smaller slice. Liam is No. 1 for 2025, and Robert was No. 1 for 1926. Both facts are rank facts. Neither tells you how common the name felt in a classroom.
That’s why we report the 2020–2025 shares on this page as share of SSA’s decade universe, and not as share of all U.S. births. SSA’s universe is the denominator we can actually verify, and it’s the right one for comparing SSA names with each other. If you want the full treatment of rank versus count, the sibling article on why position alone can mislead owns that topic.
Worked example: turning decade counts into shares
Here’s the method, so you can repeat it for any name in SSA’s decade tables. We’ll use James because it appears in every decade.
- Open the decade page and note the total for the sex you’re studying. The 1950s boys’ total is 20,522,672.
- Find the name’s count in that table. James has 843,768 in the 1950s.
- Divide: 843,768 ÷ 20,522,672 ≈ 4.1% of boys in SSA’s 1950s universe.
- Repeat for another decade. In 2020–2025, James has 72,523 out of 11,136,649 boys, about 0.65%.
- Compare shares, not ranks. James ranks 1st in the 1950s and 4th in 2020–2025, a small rank change, but its share is roughly one-sixth of what it was.
That last line is the whole argument for doing the arithmetic. A name can look stable by rank and still be a much smaller presence in daily life.

Spellings, sex categories and ties
Three of SSA’s rules are harmless over a year and quietly reshape trends over a century. All three are stated on the agency’s background page.
Each spelling is its own entry
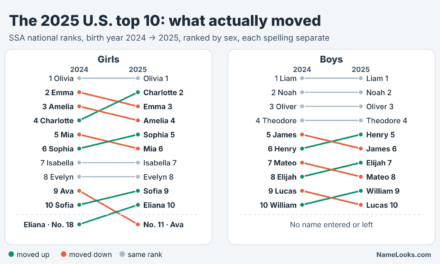
SSA does not merge spelling variants. Its own example is Caitlin, Caitlyn and Kaitlyn, which each get their own rank. In 2025, Sophia is the No. 5 girls’ name and Sofia is No. 9, two separate entries in the same top ten. SSA’s May 2026 blog post on the new list says it directly: “each spelling is ranked separately, which can shuffle the order.”
Over a century, this matters in two ways. A sound can look like it’s fading when it’s really spreading across new spellings. And older eras, which often had one dominant spelling, will look more concentrated than newer ones partly for that reason. There’s one exception in the other direction: SSA removes hyphens and spaces, so Julie-Anne, Julie Anne and Julieanne count as one entry. If you’re tracking a sound rather than a spelling, the sibling page on tracking a revival name’s whole spelling family shows how to add variants up honestly.
Separate sex lists and alphabetical ties
SSA ranks names separately by the sex recorded on the application, and it doesn’t edit those records, so it warns that “the sex associated with a name may be incorrect.” Over a hundred years, a name moving from one list to the other can look like a decline on one side and a rise on the other. That’s a topic of its own, covered in our article on how a name shifts between mostly male and mostly female use.
Ties are broken alphabetically. The 1920s girls’ table has a neat example: Beatrice and Esther both show 49,230 occurrences, and Beatrice gets rank 52 while Esther gets 53 simply because B comes before E. One rank of difference between two names is sometimes no difference at all.
The privacy floor moves the bottom, not the top
SSA leaves out any name with fewer than five occurrences in a given geographic area. That barely touches the top-200 decade tables, but it does mean the national files never show the rarest names. A name that “appears from nowhere” in the data may simply have crossed the five-baby line.
3Four shapes a name can trace across ten decades
Once you’ve got the measuring habits in place, the decade tables become a kind of fossil record. A single name’s ranks, read left to right across eleven tables, form a recognizable shape. Among the names we checked, four shapes covered nearly everything we saw. They aren’t official categories; they’re a reading aid we built from SSA’s decade pages, and the names below are there to demonstrate each shape, not to recommend anything.
The rise-peak-plateau-decline arc of an individual trend has its own article, how long a name trend lasts, which goes deeper on timing within one wave. This section is about what those waves look like when you stack a whole century of them.
Reading baby name trends 100 years at a time: the four shapes
For each example, the ranks come from SSA’s decade tables as of March 2026, in order from the 1920s to 2020–2025. “Out” means the name wasn’t in that decade’s top 200, which is where those tables stop. It doesn’t mean nobody used the name.
The steady holder
James is the cleanest example in the boys’ tables: 3, 2, 1, 1, 4, 5, 6, 13, 17, 9, 4. Its weakest decade, the 2000s, still has it at 17th. William behaves similarly, 4th in the 1920s and 6th in 2020–2025, with a dip to 15th in the 1980s along the way. These names don’t cycle so much as wobble around a high baseline.
What a steady holder offers a chooser is predictability of feel. Nobody hears James and places the bearer in a particular decade. What it doesn’t offer is distinctiveness: across the century, James is the most-used boys’ name in SSA’s 100-year table. Our cluster’s companion on classic names that never left the top rankings looks at that group in detail.
The generational wave
Linda is the textbook wave. Out of the top 200 in the 1920s, 89th in the 1930s, 2nd in the 1940s and 1950s, 7th in the 1960s, 68th in the 1970s, 128th in the 1980s, and out again by the 2010s. Jennifer runs the same course one generation later: out through the 1940s, 98th in the 1950s, 20th in the 1960s, 1st in the 1970s, 2nd in the 1980s, 16th in the 1990s, 39th in the 2000s, and out by the 2010s.
A wave name ends up strongly tied to an age group, which is the whole reason the grandmother at the party can be named Linda. That tie is a matter of statistics, not character: it tells you when a lot of people with the name were born, and nothing about any one of them.
The long-gap return
This is the shape the 100-year rule is really about. Evelyn: 12, 30, 61, 112, 168, out, out, 195, 80, 13, 9. Theodore: 64, 76, 98, 118, 152, 181, then out for the 1980s, 1990s and 2000s, then 97 and 9. Charlotte: 78, 71, 59, 115, 160, out, out, out, 136, 9, 3. Each spent roughly two to four decades at or near the bottom before climbing back.
Henry makes the trip without ever leaving the table: 18th in the 1920s, a low of 141st in the 1990s, and 7th in 2020–2025. That matters for interpretation. A name that never fully disappeared may have had a smaller, steady base of families keeping it alive, which is different from a name that truly lapsed and was rediscovered.
The slow fade
Mary is the century’s most important example of the fourth shape: 1, 1, 1, 1, 2, 15, 35, 39, 65, 127, 132. There’s no crash, no sudden abandonment, just fifty years of gradual retreat from an extraordinarily high starting point. In the 100-year table it’s still the most-used girls’ name by a wide margin.
A slow fade can be mistaken for a wave if you only look at two decades, and for a steady holder if you only look at the 100-year total. That’s the strongest argument for reading all eleven decade tables rather than picking two endpoints.
| Name (SSA list) | 1920s | 1950s | 1980s | 2010s | 2020–2025 | Change across the century | Caveat | Naming implication |
|---|---|---|---|---|---|---|---|---|
| James (boys) | 3 | 1 | 6 | 9 | 4 | Steady holder | Share fell sharply even as rank held | Timeless feel; many namesakes of all ages |
| Mary (girls) | 1 | 1 | 35 | 127 | 132 | Slow fade | Single spelling only | Familiar to everyone, now uncommon among babies |
| Linda (girls) | Out | 2 | 128 | Out | Out | Generational wave | “Out” = below rank 200, not zero | Strong age signal for listeners |
| Jennifer (girls) | Out | 98 | 2 | Out | Out | Wave, one generation later | Rise in the 1960s–70s was steep | Fast rise, fast fall in the decade tables |
| Evelyn (girls) | 12 | 112 | Out | 13 | 9 | Long-gap return | 2020s is a partial decade | Revival is real, but future path is unknown |
| Theodore (boys) | 64 | 118 | Out | 97 | 9 | Long-gap return, now well above its 1920s rank | Nicknames like Theo are separate entries | Exceeded its 1920s rank; check the yearly slope |
| Henry (boys) | 18 | 61 | 132 | 33 | 7 | Return without disappearing | Stayed inside the top 200 all century | Long-standing base, recent climb |
| Dorothy (girls) | 2 | — | — | — | Out | No return yet | We checked only the 1920s and 2020s tables | A century gap alone doesn’t bring a name back |
A dash in the table means we didn’t check that decade for that name, not that it was absent. We kept the table to names whose point is the shape; the ranks are from SSA’s pages, and the labels in the “change” column are our reading.

What pushes names along these shapes
The data show shapes; they don’t label causes. Researchers have proposed several mechanisms, and the honest summary is that each one explains part of the record and none explains all of it. Here’s what three well-cited lines of work actually claim, in their own terms.
Internal momentum: Lieberson’s argument
According to Evans’s review in Names, Lieberson argued that name fashion is driven partly by “internal mechanisms of taste”: small, one-directional shifts he called a ratchet effect, and “taste stems” where one popular name helps generate related ones. The review gives the example of Carol leading to Carolyn, Karen and Carrie. Lieberson also argued that celebrities usually “ride the curve,” picking up names that were already rising.
For a parent, the useful idea is that a name’s sound neighbors matter. If several names sharing a sound are climbing together, the sound itself may be in fashion, and your “unusual” pick may arrive with a lot of near-relatives. Evans’s review also records his disagreements, including that Lieberson underplayed television, which is a fair reminder that this is an argued position, not settled fact.
Random copying: the drift model
Matthew Hahn and R. Alexander Bentley took a different approach in a 2003 paper in Proceedings of the Royal Society B. Looking at U.S. baby names for each decade of the twentieth century, they found that name frequencies follow a stable power-law pattern, even as names came and went, and that a simple model of people randomly copying names from one another reproduces it.
The point isn’t that parents choose randomly. It’s that a few names can become very common without any special quality, simply because popularity compounds. That’s a healthy corrective whenever someone offers a confident story for why a particular name took off.
Speed and the fear of fads
Berger and Le Mens add the individual-level piece. Their PNAS paper reports that expecting parents were more hesitant about names that had recently risen sharply, and the authors attribute this to symbolic concerns: people view fads negatively and avoid things they expect to be short-lived. A Knowledge at Wharton write-up of the study gives one illustration: Charlene, Tricia and Kristi each peaked at roughly 0.2% of U.S. girls, but Charlene rose slowly and lasted longest, while Tricia surged and faded fastest.
Notice what this does and doesn’t license. It’s a tendency across many names, not a forecast for yours. A name climbing fast this year has a higher chance of sliding later, on average. It may also turn into the next steady holder. The research can’t tell you which.
4Use the century view when you’re weighing a name
None of this is only trivia. If you’re choosing a name, the long view answers questions a single year’s chart can’t: will this name read as belonging to a particular generation, is it climbing faster than usual, and is its current popularity a return, a wave or a plateau? It won’t answer whether you’ll love the name, and it shouldn’t try. For the broader decision, our framework for choosing a name puts popularity alongside meaning, sound and family, where it belongs.
A four-question century check
Here’s a method that takes about twenty minutes per name using only SSA’s free pages. It’s the practical version of looking at baby name trends 100 years back for a single name. It doesn’t need downloads or software, and it deliberately avoids anything that would tempt you into forecasting.
How to run it with SSA’s own tools
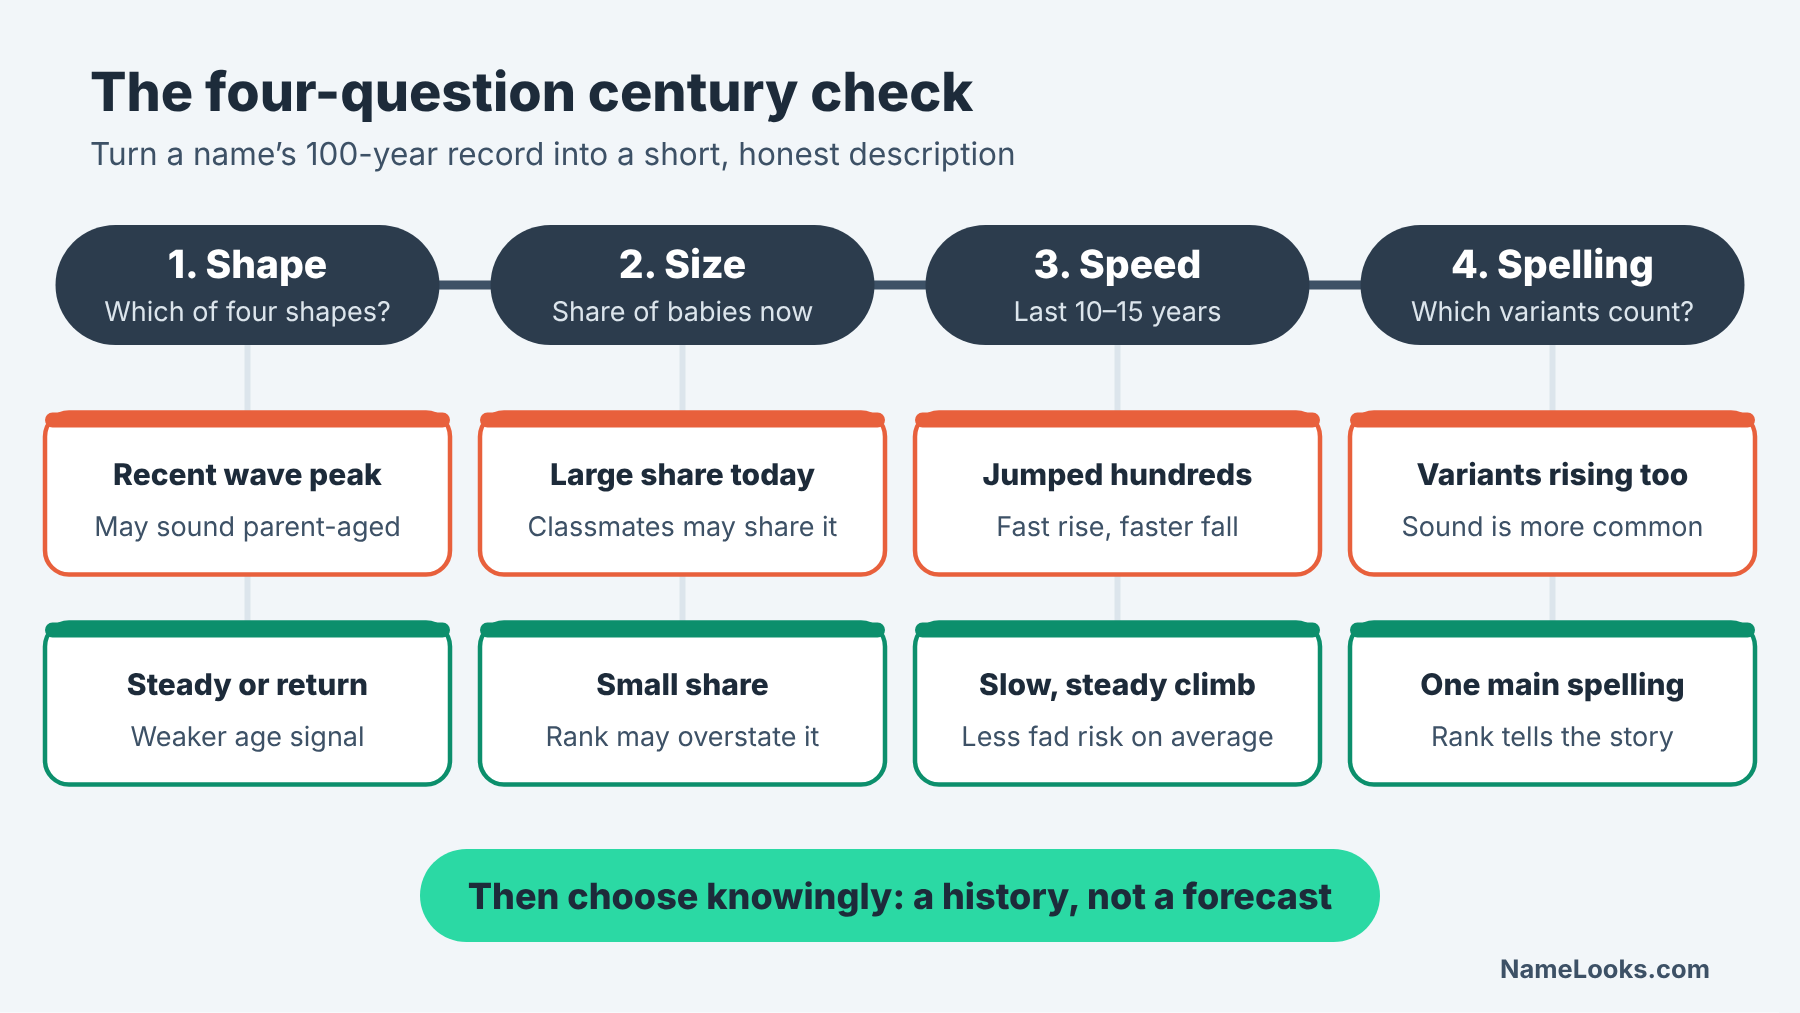
- What shape has it traced? Look the name up in each of SSA’s decade tables from the 1920s to the 2020s and write down the rank or “out.” You’ll quickly see which of the four shapes you’re dealing with.
- How big is it, really? For the current decade and one earlier peak, divide the name’s count by the decade total, as in the James example above. That converts rank into a share you can compare.
- How fast is it moving now? Use SSA’s name-by-name popularity tool on the main baby names page to see the yearly ranks for the last ten or fifteen years. A climb of a few places a year is different from a jump of hundreds.
- Which spellings belong with it? List the spellings you’d consider “the same name” and check each one. If two or three are rising together, the sound is more common than any single rank shows.
Write the answers down in one line each. The goal is a short, factual description of the name’s history, something like “long-gap return, about 0.5% of girls in 2020–2025, climbing steadily, one dominant spelling.” Then decide how you feel about that description.
What to look for in the answers
In our editorial reading, a few combinations deserve a second look. A generational wave whose peak was thirty to fifty years ago is the most likely to read as “my mom’s friends’ names” to your child’s peers’ parents. A long-gap return that’s still climbing quickly may be near the steep part of its own wave. A steady holder with a sharply smaller share than it once had may be less common in your child’s classroom than its rank suggests.
None of those is a reason to reject a name. They’re reasons to choose it knowingly. If the wave-shaped name is a family name you want to honor, the century data just tells you what listeners might assume, and you can decide that doesn’t matter.
The question the century can’t answer
Whether a name will be popular when your child is ten is a forecast, and SSA publishes no forecasts. The century record tells you about tendencies across many names. Use it to understand a name’s history and its current momentum, not to predict its future.
Two hypothetical families, one dataset
These are illustrations, not case studies. They show how the same century of data supports different decisions depending on what a family values.
The family name that skipped three generations
Imagine a couple who want to use a great-grandmother’s name, Evelyn, partly because it’s family and partly because it sounds fresh to them. The century check shows a long-gap return: 12th in the 1920s, out of the top 200 in the 1970s and 1980s, 9th in 2020–2025. They also see that it’s in SSA’s 2025 top ten for girls.
The data doesn’t change the family meaning, but it does adjust expectations. Evelyn will not feel rare in a 2030s classroom; it’ll feel current. If they wanted the name for its family tie, that’s fine. If part of the appeal was that “nobody uses it anymore,” the 2025 list has already answered that. Our companion page on how much uniqueness you actually want is the right next stop for that second question.
The parent who doesn’t want a name that dates
Now picture a parent who was one of several Jennifers in their own class and wants to avoid a repeat. They’re drawn to a name that has jumped hundreds of places in a few recent years. The century check flags the speed: it looks more like the steep side of a wave than a steady climb.
The research gives that worry some support, on average. Berger and Le Mens found that faster adoption tends to come with faster abandonment. But “on average” is the operative phrase. The parent might reasonably shift toward a name with a steadier history, or keep the fast riser and accept the risk. Both are defensible. What isn’t defensible is claiming either name is certain to date or certain to last.
Where the long view stops helping
Every dataset has edges. These are the ones that matter most when you’re using a hundred years of rankings to make a personal decision.
It describes populations, not people
A name’s century shape tells you when many people with that name were born, in SSA’s records. It doesn’t tell you anything about any individual bearer: their age, background, family or identity. Two children named Linda, born forty years apart, are equally Lindas. Reading a person’s age or anything else from their name is a guess the data doesn’t support.
It also tells you nothing about meaning, origin or pronunciation. SSA records spellings on applications; it doesn’t record how families say a name or why they chose it. For questions of meaning, start with a sourced reference, as our guide to name meanings and origins explains.
It’s national, and it’s U.S.-only
Every number on this page is for the 50 states and D.C. combined. A name can trace one shape nationally and a different one in your state, which is why the cluster has a separate page on when national rank hides regional differences. And the U.S. pattern isn’t the world’s pattern. England and Wales, for example, publish their own rankings through the Office for National Statistics, with different methods and a different naming market.
Within the U.S., the national table also can’t separate the many communities and languages it combines. A name that’s declining nationally may be steady or rising within a particular community, and SSA’s tables have no way to show that. Don’t read the national shape as everyone’s shape.
5How the long view changes this year’s headlines
Every May, SSA publishes the new national list and the headlines follow. The 2025 list arrived on May 8, 2026, with a press release announcing Olivia and Liam at No. 1 for the seventh straight year. The century record is the best antidote to over-reading that kind of news, because it shows you what “big change” has looked like before.
The 2025 list, seen from 1926
The full story of what moved in 2025 belongs to our page on what changed in the 2025 U.S. rankings. Here we’re only asking how the latest list fits the century patterns above.
What fits the patterns
The 2025 girls’ top ten includes Charlotte at 2 and Evelyn at 8, both names that were in the 1920s top 200 and then dropped out of it for at least one later decade. That’s Pattern 4 in action. SSA’s release also notes that Charlotte’s rise to No. 2 ended Emma’s six-year run in the runner-up spot, and that Ava left the top ten while Eliana entered it at No. 10. Movement just below the top is ordinary churn for girls’ names, which is Pattern 2.
On the boys’ side, the release says the top four held their places from the prior year. Theodore at 4 and Henry at 5 sit beside William at 9 and James at 6, a mix of long-gap returns and steady holders. Boys’ lists move more slowly, as Pattern 3 would suggest.
What the century warns you not to conclude
Seven years at No. 1 sounds like dominance, and in modern terms it is. But Liam’s share of boys in 2020–2025, about 1.1% of SSA’s universe, is a fraction of what Robert or James held at their peaks. A long reign in a fragmented field isn’t the same thing as a long reign in a concentrated one. Our sibling on why seven years at No. 1 doesn’t mean naming has stopped changing picks that apart.
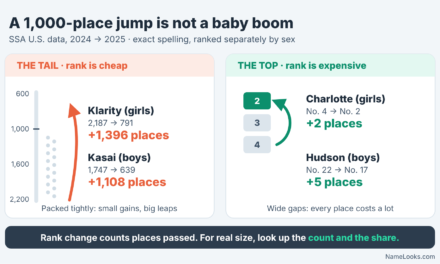
Likewise, the fastest risers each year are usually names jumping from small counts, which makes big rank moves easy. SSA’s release highlights, for example, Kasai jumping 1,108 places to enter the boys’ top 1,000 at 639. A century of data says to watch what such names do over the next five to ten years before calling them a trend. The cluster’s piece on rank jumps versus real birth counts explains why.
A better unit than one year
The more time you spend with baby name trends 100 years long, the less a single year feels like the right unit for anything except headlines. Two alternatives are better for most questions.
Use multi-year windows
SSA’s 2020s table already sums six years, 2020 through 2025, which smooths out one-year noise. For a name you’re considering, comparing its count across a recent five- or six-year window with an earlier window says more than any single rank. Our page on using 2020–2025 counts instead of one-year hype shows that approach applied to the current decade.
The same logic works backwards. If you want to know whether a name is a revival, compare its decade totals, not one peak year with one recent year. A single year can catch a name at a local high or low and make a modest change look dramatic.
Know the dataset before you trust the trend
Most mistakes in long-run name talk aren’t about taste; they’re about the dataset. Mixing SSA’s yearly top five with its decade tables, treating “out of the top 200” as “extinct,” or comparing a rank from 1926 with a rank from 2025 as though they meant the same thing will all produce confident nonsense. If you only read one technical page in this cluster, make it how SSA’s rankings are built.
And when you want the latest national picture with all of that context in place, start from the cluster’s hub on the most popular baby names in the U.S., then come back here for the century view.
Questions people actually ask
Do names really come back every 100 years?
Some do, but there’s no schedule. In SSA’s decade tables, Evelyn, Charlotte, Henry and Theodore returned to the top ten after long absences or declines, while Dorothy, Helen and Betty, top-four girls’ names of the 1920s, aren’t in the 2020–2025 top 200. A century gap seems to make a name available for revival; it doesn’t make revival likely.
Which name was No. 1 the most years in the last century?
For U.S. births from 1926 to 2025, SSA’s top-five page says Michael was the No. 1 boys’ name in 44 years and Mary the No. 1 girls’ name in 30 years. Those are rank facts for those exact spellings. By total count across the century, the leaders are James for boys and Mary for girls.
Why does SSA’s 1920s data look strange?
SSA’s data are built from Social Security card applications, and SSA notes that many people born before 1937 never applied for a card. So the early decades reflect who later applied for a card. One visible symptom: the 1920s and 1930s decade totals show more girls than boys, the reverse of every later decade in SSA’s tables.
Can I find a name’s full 100-year history for free?
Yes. SSA’s baby names site lets you look up one name’s popularity by year, and its decade pages show the top 200 per decade. For names below the top 1,000 in a given year, SSA offers a downloadable national file on its “beyond the top 1000” page, though exact spellings with fewer than five births in an area are excluded for privacy.
Is a boy’s name less likely to date than a girl’s?
In this century of SSA data, boys’ names at the top have tended to stay near the top longer: seven of the 1920s top ten boys’ names are in the 2020–2025 top 200, against three of the girls’. That’s a group tendency in U.S. data, not a rule for any one name, and the data can’t explain why it happens.
Should I avoid a name that’s rising fast?
Not necessarily. Published research found that, on average, names adopted quickly were also abandoned faster. That’s useful context if you care about a name feeling tied to one period, but it can’t tell you what will happen to a particular name, and plenty of parents reasonably choose a name they love regardless of its trajectory.
Sources and further reading
- SSA: Top 5 names in each of the last 100 years — No. 1 to No. 5 for each sex, U.S. births 1926–2025; the basis for the turnover counts here.
- SSA: Top names over the last 100 years — cumulative counts for 1926–2025 and the total births behind them.
- SSA: Popular names by decade — top 200 per decade with counts and decade totals; the source of every decade rank on this page.
- SSA: Background information — data source, the pre-1937 caveat, the five-occurrence rule, spelling and tie-breaking rules.
- SSA: Beyond the top 1000 names — share of births covered by the top 1,000, 2016–2025, and the national data download.
- SSA press release, May 8, 2026 — the official announcement of the 2025 top names and notable changes.
- Berger & Le Mens (2009), PNAS 106(20) — research on adoption speed and abandonment using U.S. and French name data.
- Hahn & Bentley (2003), Proc. R. Soc. B 270 — the random-copying (drift) model applied to 20th-century U.S. names.
- Evans (2002), review of Lieberson’s A Matter of Taste, in Names 50.4 — a critical summary of the best-known book on name fashion.
NameLooks provides general information about names and name data. Popularity figures describe U.S. birth records at the population level, not any individual who bears a name, and the ranks and shares above reflect SSA data as of March 2026.