
The most common mistake people make with the top baby names 2020s question is answering it with one year’s list. The 2025 rankings are a snapshot of a single birth year, while the kids your child will grow up beside were born across six of them. This page reads the Social Security Administration’s 2020–2025 period counts instead, shows where they disagree with the latest headlines, and turns the difference into a practical check for your own shortlist.
The short version
- SSA already publishes a 2020s table. Its “Top names of the period 2020–2025” page ranks the 200 most common names across all six birth years combined, using card-application data as of March 2026. SSA itself calls it a rough indication of the final decade ranking.
- The six-year leaders are Liam and Olivia. Liam has 124,842 boys and Olivia 95,853 girls in that table, which works out to roughly 1 in 89 boys and 1 in 111 girls in SSA’s period universe.
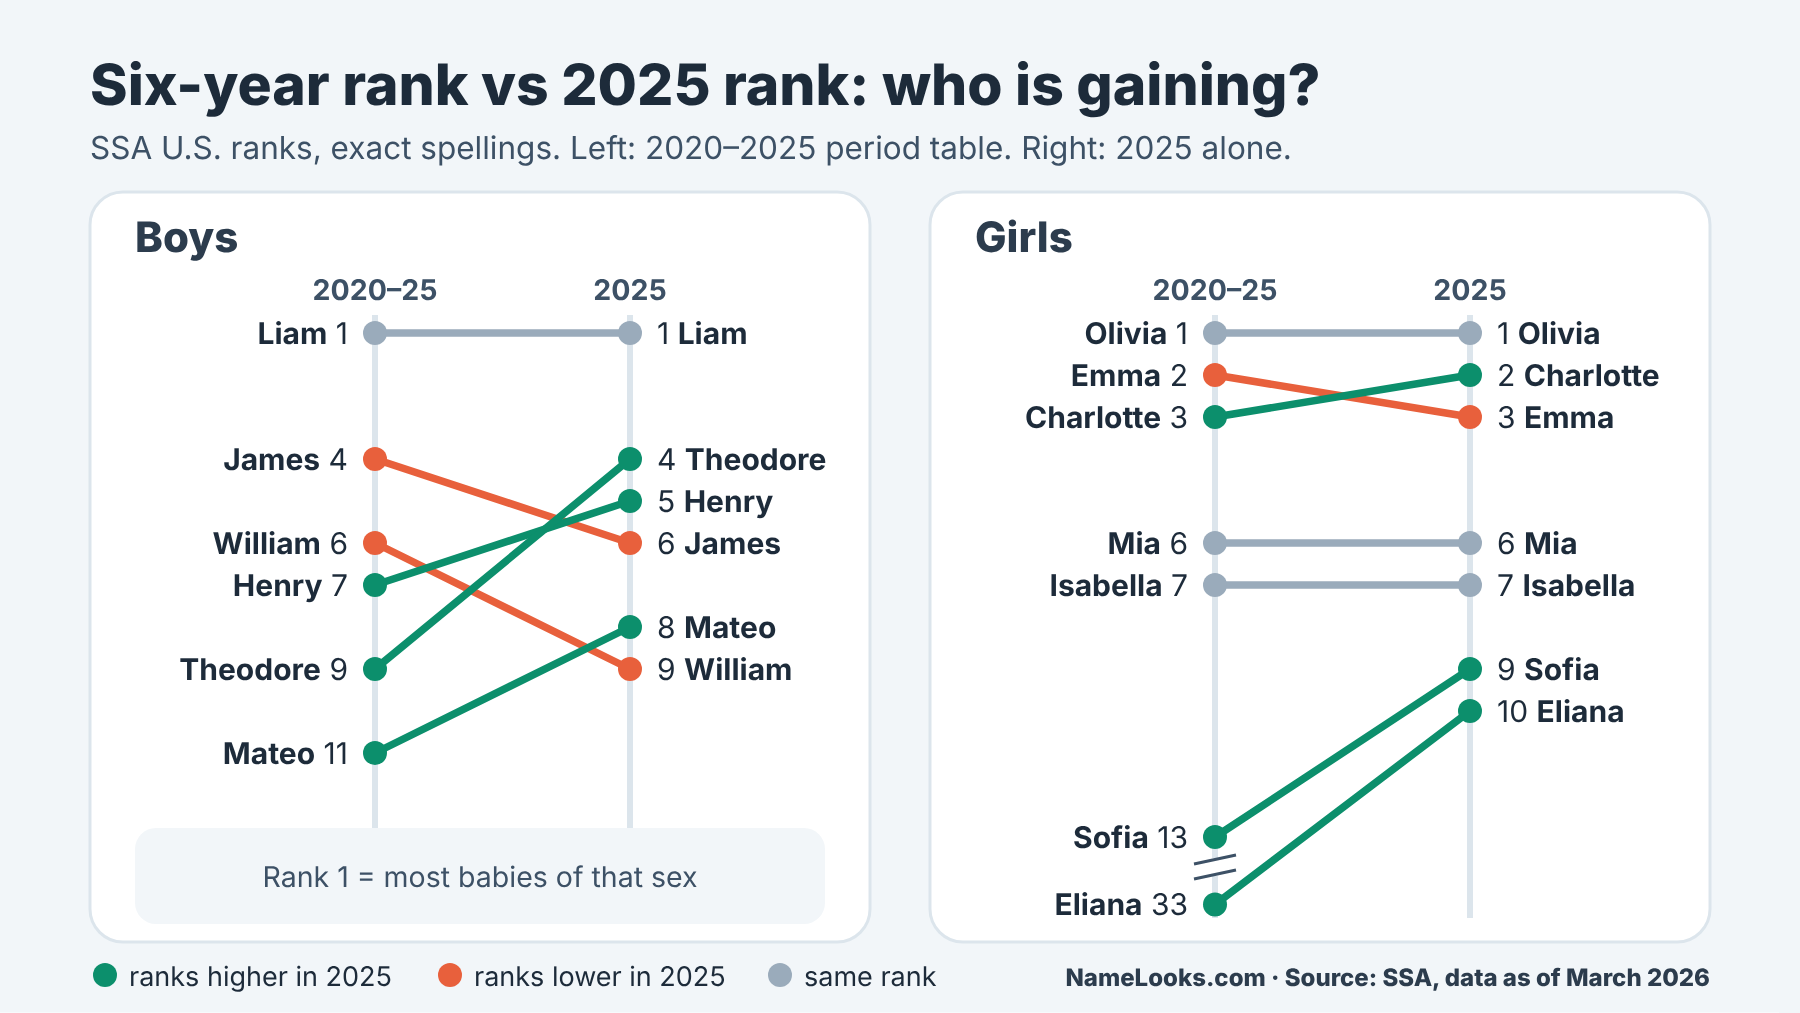
- Current rank and six-year rank often differ. Theodore is No. 4 for 2025 but No. 9 for 2020–2025; Eliana is No. 10 for 2025 but No. 33 for the period. One list measures momentum, the other measures how many children already have the name.
- Many rank gaps are statistical dust. William (No. 6) and Henry (No. 7) are 20 births apart across six years. Treat neighbors like that as tied.
- Each spelling is its own entry. Sophia and Sofia sit at separate ranks in SSA’s tables. Adding them is your own calculation, not SSA’s, and you should label it that way.
1Top baby names 2020s so far: what the 2020–2025 counts say
Here is the answer first. Across U.S. births from 2020 through 2025, the most common names in SSA’s data are Liam, Noah and Oliver for boys and Olivia, Emma and Charlotte for girls. That top three is not the same as the 2025 top three for girls, and the order further down differs from the 2025 list in ways that matter if you’re trying to guess how many classmates a child will share a name with.
The rest of this section shows where those figures come from, how they differ from the single-year list, and how to turn a count into something you can picture. If you need the broader tour of how SSA rankings are built and released, the cluster guide on reading the latest SSA rankings covers it; here we stay on the six-year view.
The mistake: reading the 2025 list as the list of the decade
Every May, SSA publishes the previous year’s top names, and every May the coverage tends to describe them as the names of the moment. That’s fair for the moment. It becomes a problem when the same list gets quietly promoted to “the names of the 2020s,” because a single year can’t tell you how many children already carry a name.
What the 2025 release does and doesn’t show
SSA’s announcement of the 2025 names, dated May 8, 2026, lists the boys’ top 10 as Liam, Noah, Oliver, Theodore, Henry, James, Elijah, Mateo, William and Lucas. The girls’ top 10 is Olivia, Charlotte, Emma, Amelia, Sophia, Mia, Isabella, Evelyn, Sofia and Eliana. The release notes that Charlotte rose to No. 2, ending Emma’s six-year run in that spot, and that Eliana entered the top 10 while Ava left it.
All of that describes babies born in calendar year 2025. It says nothing about the 2020 or 2021 cohorts who are already in preschool. A name can be climbing fast in 2025 and still be shared by fewer children overall than a name that was strong in 2020 and has since cooled. For a deeper read of what moved within that single year, see our piece on what changed in the 2025 U.S. rankings.
Where the period table and the 2025 list part ways
SSA also publishes a page titled “Top names of the period 2020–2025”. It ranks the 200 most popular names for boys and girls born across those six years, counting every birth in the window together. The decade index page explains that popularity by decade is determined the same way as for a single year: count the occurrences of each name, then rank by frequency.
Put the two lists side by side and the disagreements jump out. Emma is No. 3 in 2025 but No. 2 for the period, ahead of Charlotte. James is No. 6 in 2025 and No. 4 for the period. Theodore runs the other way: No. 4 in 2025, No. 9 across six years. Eliana, new to the 2025 top 10, sits at No. 33 in the period table. Harper and Benjamin are in the period top 10 without appearing in the 2025 top 10 at all.
Why both lists are “right”
The 2025 list answers “what were parents choosing most last year?” The period table answers “how many children born so far this decade have this name?” Neither is wrong. They’re measuring different things, and the second one is the better guide to how often a child will meet a namesake.
The six-year leaders by count, with shares you can picture
Counts are concrete, but a count only becomes meaningful next to the total it came from. The SSA period page says its 200 names were drawn from a universe of 11,136,649 boy births and 10,652,963 girl births. Dividing a name’s count by that universe gives its share of the period’s births in SSA’s records. We did that arithmetic below; SSA publishes the counts, not these percentages.
Boys: two clear leaders, then a crowded middle
Liam leads with 124,842 boys, about 1.12% of the boy universe, or roughly 1 in 89. Noah follows with 116,024 (about 1.04%). Then the drop is steep: Oliver has 89,293, and James at No. 4 has 72,523. From there the field bunches up. Elijah (72,049), William (68,067), Henry (68,047), Lucas (65,795), Theodore (65,579) and Benjamin (64,922) fill ranks 5 through 10, separated by a few thousand births at most.
Added together, the period’s top 10 boys’ names account for 807,141 boys, or about 7.25% of the universe. Extend that to the top 40 names, which reach down to Dylan at 41,138, and you cover about 20% of boys. In plain terms, four out of five boys born in the 2020s so far have a name outside the top 40.
Girls: one leader and a long, flat shelf
Olivia leads with 95,853 girls, about 0.90% of the girl universe, or roughly 1 in 111. Emma follows with 85,652, then Charlotte (78,055), Amelia (76,108) and Sophia (74,758). Mia and Isabella are close behind at 68,154 and 67,643. The top 10 girls’ names together cover 712,816 girls, about 6.69% of the universe, and the top 40 cover about 17%.
Girls’ names are more spread out than boys’ names in this table. The No. 1 girls’ name has a smaller share than the No. 1 boys’ name, and the top 40 cover a smaller slice. That isn’t a law of nature: in SSA’s 2010s table, the No. 1 girls’ name, Emma, held a larger share of girls than Noah held of boys. The point for you is narrower. In the 2020s so far, a top-10 girls’ name is shared by fewer children than its rank might suggest.
Rank, count and share: three different answers to “how popular?”
Before going further, it helps to pin down vocabulary, because most confusion about the 2020s lists comes from mixing these three up. Our sibling article on why position alone can mislead goes deep on this; the short version follows.
Each metric answers a different question
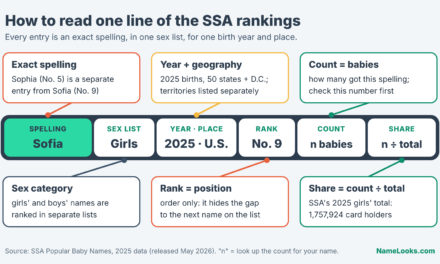
Rank is position in the ordering. It tells you which name is ahead of which, and nothing about by how much. Count is the number of babies SSA recorded with that exact spelling and sex category. Share is the count divided by total births of that sex in the same window, and it’s the number closest to what parents actually care about: how likely is a child to meet someone with the same name?
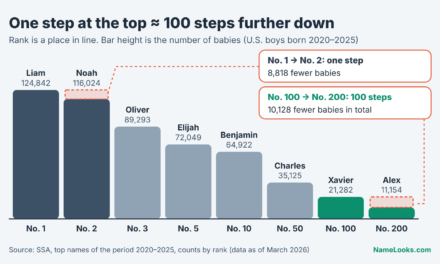
A rank of No. 7 can mean wildly different things. In the 2020–2025 boys’ table, No. 7 (Henry) is 20 births behind No. 6. In the girls’ table, No. 7 (Isabella) is 511 behind No. 6. Same rank number, different story.
Each spelling is its own entry
SSA’s background notes on the names data say that different spellings of similar names are not combined. Its 2025 blog post puts it more bluntly: each spelling is ranked separately, which can shuffle the order. In the period table, Sophia is No. 5 with 74,758 girls and Sofia is No. 13 with 45,288.
If you add them, you get 120,046, which is more than Olivia’s count. That sum is a legitimate calculation, but it’s yours, not SSA’s, and it assumes every family hears the two spellings as one name. Some will and some won’t. Say what you did if you share the number. The spelling question gets its own treatment in our article on Sophia and Sofia as separate variants.
| Name (exact spelling) | 2025 rank | 2020–2025 rank | 2020–2025 count | Direction of the gap | Caveat | What it implies for a parent |
|---|---|---|---|---|---|---|
| Liam (boys) | 1 | 1 | 124,842 | Same | Leader in both views | The most-shared boys’ name of the decade so far, about 1 in 89 |
| Theodore (boys) | 4 | 9 | 65,579 | Current rank ahead | Only 216 behind No. 8 Lucas | Fewer older namesakes than its 2025 rank suggests; more peers in later cohorts |
| Henry (boys) | 5 | 7 | 68,047 | Current rank ahead | 20 births behind No. 6 William | Effectively tied with William across the six years |
| James (boys) | 6 | 4 | 72,523 | Period rank ahead | 474 births ahead of Elijah | Already widely shared; the 2025 rank undersells it |
| Mateo (boys) | 8 | 11 | 62,272 | Current rank ahead | Spelling variants ranked separately | Check related spellings before judging how common it sounds |
| Benjamin (boys) | Not in top 10 | 10 | 64,922 | Period rank ahead | Top-10 status depends on the window | A strong early-decade name that still has many peers |
| Charlotte (girls) | 2 | 3 | 78,055 | Current rank ahead | 7,597 behind Emma for the period | Rising within the decade; Emma is still shared by more girls |
| Sofia (girls) | 9 | 13 | 45,288 | Current rank ahead | Sophia is a separate entry at No. 5 | Spoken-name popularity is higher than either spelling’s rank |
| Eliana (girls) | 10 | 33 | 33,359 | Current rank far ahead | Largest gap among these names | New to the top 10; far fewer older namesakes so far |
| Harper (girls) | Not in top 10 | 10 | 47,509 | Period rank ahead | Top-10 status depends on the window | Many children born early in the decade already have it |
The table only uses ranks and counts SSA published on its period page, 2025 announcement and landing page. SSA’s single-year counts for 2025 aren’t shown because we couldn’t open the per-year count tables in this session; you can look them up yourself through the search tools on the SSA Popular Baby Names page.
2Why one year of rankings makes a poor summary of a decade
If the period table exists, why do so many “top baby names 2020s” roundups still lean on a single year? Partly habit, partly because the annual release is news and the period table isn’t. But there are also real reasons the two views diverge, and understanding them tells you which one to trust for which question.
Stock versus momentum
Think of a six-year count as a stock: the total number of children who already have a name. Think of the latest annual rank as momentum: where parents are heading right now. A name can be high on one and middling on the other, and both readings are informative.
Names whose current rank runs ahead of their six-year rank
Theodore is the cleanest example. It’s No. 4 among 2025 boys and No. 9 for 2020–2025. SSA’s top-five names by year page shows Theodore entering the boys’ top five in 2024 at No. 4 and staying there in 2025. Before that, it wasn’t in the top five in any year of the decade. So its six-year total includes early years when fewer families chose it.
Henry follows the same pattern more mildly: No. 5 in 2025, its first top-five appearance of the decade on SSA’s top-five page, and No. 7 for the period. Mateo (No. 8 in 2025, No. 11 for the period) and Eliana (No. 10 in 2025, No. 33 for the period) are other names where the current list makes a name look more widely shared than it is among children born so far this decade.
Names coasting on early-decade strength
The opposite happens too. Ava was No. 3 among girls in 2020 and No. 5 in 2021, according to SSA’s top-five page, then left the top five; the 2025 announcement notes it dropped out of the top 10. Yet in the period table it still sits at No. 8 with 63,350 girls. Those children exist, and they’ll be in classrooms for years.
William is similar on the boys’ side. It was No. 5 in 2020 on the top-five page and is No. 9 in 2025, but No. 6 for the period. Harper and Benjamin are both in the period top 10 and absent from the 2025 top 10. If you were judging “how common is this name among kids my child’s age” from the 2025 list alone, you’d underestimate all of them.
A rule of thumb that holds up
When a name’s current rank is better than its period rank, it’s gaining. When the period rank is better, it’s cooling, but its existing namesakes don’t vanish. For questions about peers, weight the period count. For questions about where tastes are heading, weight the recent years.
Six years is not a decade, and the window shapes the answer
The period table is a partial decade, and SSA says so in plain words. That label matters more than it looks, because the length of a window changes the numbers it produces.
SSA’s own warning about partial-decade rankings
The 2020–2025 page says that, being based on data for 6 of the 10 years in the decade, its rankings are a rough indication of the ultimate rankings for the complete decade. That’s an unusually candid caveat from a statistical agency, and it’s worth repeating whenever you quote the table. A name that is climbing now could still pass several of the names above it by the time 2029 is counted.
Look at the arithmetic for Theodore and Lucas. They’re 216 births apart for 2020–2025. Theodore currently ranks higher in the annual list. Unless that changes, the period gap is very likely to close in the next release. We wouldn’t put a date on it, though; annual ranks can reverse, and SSA’s caution applies here as much as anywhere.
Shorter windows can look more concentrated
Compare the leaders across SSA’s period pages. In the 2010s table, Noah leads boys with 183,378 out of a universe of 20,110,846, about 0.91%. In the 2020–2025 table, Liam has about 1.12%. That looks like rising concentration at the top. It might be partly real, but part of it is the window: Liam was No. 1 in every year from 2020 through 2025, while the 2010s No. 1 spot changed hands over that decade, according to SSA’s top-five page.
A name that leads every year of a short window will always look dominant within it. Over a full decade, turnover at the top tends to spread the counts. So when you compare the 2020s so far with earlier decades, compare like with like, or at least say that one window is six years and the other is ten.
Snapshot dates, cohort sizes and the five-birth floor
Three smaller technical details shape the period counts. None of them should stop you from using the table. All of them should stop you from treating it as a precise census of every child.
The “as of March 2026” stamp
The period page and SSA’s background notes both describe the data as a 100% sample of Social Security card applications as of March 2026. That’s a snapshot of records at a point in time. If you saved numbers from an earlier release, they came from an earlier snapshot, so note the date whenever you compare or quote counts. The cluster article on how SSA’s birth-year counts work explains the records behind them.
The data also covers children whose families applied for a Social Security card. A child whose card application isn’t in those records isn’t in the counts, so the table describes SSA’s records rather than a full birth census. The limits of that coverage, along with the privacy floor and sex categories, are covered in our article on what the SSA dataset cannot tell you.
Cohort size and the privacy threshold
A six-year count adds births from six different years. If one birth year is larger than another, it contributes more children to every name’s total. That’s fine for counting peers, since bigger cohorts mean more actual children, but it means the period rank isn’t an average of six annual ranks. It’s a single ranking of pooled counts.
At the other end of the list, SSA’s background notes say names with fewer than five occurrences in a geographic area are excluded for privacy. That barely touches the top 200, but it means any attempt to add up “all spellings” of a name from the full files will miss the rarest forms. If you go hunting below the top lists, the article on names just outside the top 1000 is the better guide.
| Claim you might want to make | Source / dataset | Geography | Years | Metric | Limitation | Editorial takeaway |
|---|---|---|---|---|---|---|
| “Liam and Olivia are the top names of the 2020s so far” | SSA period table 2020–2025 | United States | 2020–2025 births | Pooled count and rank | Six of ten years; SSA calls it a rough indication | Fine to say, with “so far” and the window named |
| “Theodore is a top-five boys’ name” | SSA 2025 release; top-five page | United States | 2024 and 2025 | Annual rank | Says nothing about earlier cohorts | True for 2024 and 2025; not true for the period |
| “About 1 in 89 boys born this decade is a Liam” | SSA period count ÷ period universe | United States | 2020–2025 | Share (our calculation) | National average; local mix varies | Label as a calculation from SSA counts |
| “Sophia is more popular than Olivia” | SSA period table, two separate entries | United States | 2020–2025 | Sum of two spellings (our calculation) | SSA does not combine spellings | Only say it with the method spelled out |
| “William and Henry are equally common” | SSA period table | United States | 2020–2025 | Count (68,067 vs 68,047) | Ranks differ by one place | Defensible; the gap is 20 births |
| “Fast-rising names fade fast” | Berger and Le Mens, PNAS 2009 | United States and France | 100+ years of name data | Adoption speed vs persistence | A tendency across many names, not a forecast for one | Useful caution, not a prediction |
3Where a single rank or a playground anecdote leads you astray
Once you have the period counts in front of you, two things become obvious. First, many neighboring ranks are separated by almost nothing. Second, a few gaps near the top are genuinely large. A rank number hides both facts equally well, which is why it’s the weakest of the three metrics for judging anything on a top baby names 2020s list.
Near-ties that rank numbers disguise
In a list of 200 names drawn from more than ten million births per sex, a gap of a few dozen children is noise for any practical purpose. Yet those few dozen still decide which name gets the higher rank, and the rank is what gets quoted.

William and Henry: 20 births in six years
William has 68,067 boys in the 2020–2025 table and Henry has 68,047. That’s a gap of 20 children out of more than 11 million boys, roughly 0.0002 percentage points of share. One name is No. 6 and the other No. 7, and an article built on ranks would tell you William is “more popular.” For any question a parent might ask, they’re tied.
The same thing happens all over the table. Luke (44,149) and Luca (44,138) are 11 births apart at ranks 33 and 34, with Matthew another 86 behind. Wyatt and Aiden are 21 apart. Among girls, Eleanor and Elizabeth are separated by 73, Hazel and Avery by 21, and Grace and Nova by 15.
The girls’ shelf from No. 21 to No. 28
Chloe at No. 21 has 37,588 girls. Nora at No. 28 has 36,567. Eight ranks cover a spread of 1,021 births. If someone tells you Chloe is “seven places more popular” than Nora, the honest translation is a difference of 1,021 girls out of more than 10.6 million, under a hundredth of a percentage point of share. In practice the two names are about equally common.
A practical habit helps here: whenever you compare two names from the period table, write down the count gap and the share gap, not the rank gap. If the share gap is a few hundredths of a percentage point, treat the names as equally common and decide on other grounds.
Don’t build a story on one rank place
Statements like “Henry is now less popular than William” or “Luca overtook Luke” are technically true of a rank list and practically meaningless for families. Before repeating a rank comparison, check the count difference. If it’s tiny, say the names are effectively tied.
Gaps that are real, and what they tell you
Near the top of the table, the picture changes. A handful of names have pulled genuinely clear of the rest, and the size of those gaps is useful information that the bare rank list also hides.
Liam and Noah versus everyone else
Liam leads Noah by 8,818 boys over six years. Noah leads Oliver by 26,731, and Oliver leads James by 16,770. After that, ranks 4 through 10 fit inside a span of about 7,600 births. The top two boys’ names are a tier of their own in the 2020s so far; the next eight are a pack.
The girls’ table has a similar shape with less spacing. Olivia leads Emma by 10,201 girls and Emma leads Charlotte by 7,597. Charlotte, Amelia and Sophia then sit within about 3,300 of one another. If you’re choosing between, say, Amelia and Sophia on the grounds that one is “less common,” the period counts say the difference is small: 1,350 girls across six birth years.
What a No. 1 meant in other periods
A No. 1 name today is shared by a smaller slice of children than a No. 1 name was a generation ago. SSA’s 1990s table shows Michael leading boys with 462,466 out of 20,556,015, about 2.25%. In the 2000s, Jacob led with 274,077 out of 21,277,426, about 1.29%. In the 2010s it was Noah at about 0.91%, and in 2020–2025 Liam at about 1.12% (all shares are our calculations from SSA’s published counts and universes).
So the No. 1 boys’ name of the 2020s so far reaches about half the share Michael had in the 1990s. Remember the window effect from the previous section when you read the Liam-versus-Noah comparison. The longer story of how the top of the list has thinned out over a century belongs to our article on 100 years of U.S. top names, and the specific question of the Liam and Olivia streak is covered in why seven years at No. 1 doesn’t mean naming has stopped changing.
Anecdotes, headlines and local impressions
Much of what people believe about 2020s names doesn’t come from SSA at all. It comes from a daycare roster, a neighborhood group chat or a headline about a dramatic rank jump. These impressions aren’t worthless, but they measure something different from the national tables.
“Every kid at daycare is named…”
A single classroom is a tiny, non-random sample. National shares tell you that among 1,000 boys born 2020–2025, you’d expect about 11 Liams on average. In a room of 12 boys, that average is about 0.13 Liams. Meeting three of them in one room is unlikely by national numbers alone. When it happens, it usually reflects local naming patterns, which can differ a lot from national ones. Our article on when national rank hides regional differences shows how to check that with SSA’s state tables.
The reverse is also true. Not hearing a name around you doesn’t make it uncommon nationally. It may be concentrated somewhere else. Your impression is real data about your surroundings; just don’t mistake it for the national count.
Headlines built from rank jumps
SSA’s change-in-popularity page compares 2024 and 2025 ranks only for names that were in the top 1,000 in at least one of the two years. It also notes that popular names generally show smaller rank changes. That’s arithmetic: moving from No. 900 to No. 400 takes far fewer additional babies than moving from No. 30 to No. 10.
The 2025 announcement’s fastest-rising boys’ name, Kasai, climbed 1,108 places to No. 639. That’s a striking rank move, and it tells you something about a name’s momentum. It tells you very little about how many children born this decade have it. Rank jumps are covered properly in our piece on rank jumps versus real birth counts; for a 2020s view, a big jump is a reason to look at the counts, not a substitute for them.
4Turn the 2020–2025 counts into a naming decision
Data about the top baby names 2020s parents have chosen is only useful if it changes, or confirms, what you do with your own shortlist. This section is about that translation: which numbers to look at, in what order, and what a reasonable person can conclude from them. It doesn’t tell you what to like. That part is yours.
A reasonable takeaway: read three numbers, not one
For any name you’re considering, three readings from SSA’s tables answer most of the popularity questions families actually have. They take a few minutes to gather, and together they’re far more informative than any single rank.
The period share: how many peers?
Start with the six-year count from the period table and divide it by the matching universe (11,136,649 boys or 10,652,963 girls for 2020–2025). That share is your best national estimate of how often a child born this decade meets a same-name peer of the same recorded sex. If the name isn’t in the period top 200, the period page won’t give you a count; you’d need to add the annual counts yourself from SSA’s yearly data, which is more work but follows the same logic.
The research behind adoption trends supports looking at levels and not just at jumps. Jonah Berger and Gaël Le Mens, in a 2009 PNAS study of first names in the United States and France, reported that names adopted quickly tended to be abandoned faster, and that expecting parents were warier of names that had recently spiked. That’s a finding about tendencies across many names over more than a century, not a forecast for any one name.
The direction: is it gaining or cooling?
Next, compare the name’s 2025 rank with its period rank. If the 2025 rank is clearly better, the name is gaining within the decade, and later cohorts will likely have more of it than earlier ones. If the period rank is better, the name is cooling, but its existing namesakes stay. SSA’s top-five page and the yearly lists let you see the path year by year for names near the top.
Direction tells you something the share can’t: whether the name will feel more or less common by the time your child reaches school, among kids slightly younger than them. Our article on how long name trends last covers what rise, peak and decline usually look like over longer spans.
The spelling family: what does the name sound like it shares?
Finally, list the spellings people might hear as the same name, and look each one up separately. SSA ranks each spelling on its own, so the spoken name can be more common than any single spelling’s rank. Record each count, then decide whether you want to add them. Our guide to tracking a name family rather than one rank walks through that bookkeeping.
Be careful about what counts as “the same name.” Luke and Luca are 11 births apart in the period table and look alike on paper, but many families would say they’re different names. Spelling variants that are pronounced identically are a clearer case than names that merely share letters.

Run the check on your own shortlist
Here is the method as a sequence you can follow with a notebook or spreadsheet. It works for any name in the period table and, with a bit more effort, for names outside it.
The steps
- Write each name’s exact spelling and recorded sex category. SSA tables are split by sex, and a name used for both appears twice with separate counts.
- Look up the 2020–2025 period count and rank. Use SSA’s period page and note the snapshot date it states (currently March 2026).
- Convert the count to a share. Divide by the period universe and, if it helps, express it as “about 1 in N.”
- Note the 2025 rank and compare. Mark the name as gaining, steady or cooling.
- Look up the spellings people would hear as the same name. Record each separately, then add them only if you decide they truly count as one name, and label the total as your own.
- Check your state if it matters to you. National shares can be far from local experience.
Six steps, all using published SSA figures, and none requiring anything beyond division. The output is a short profile for each name: a share, a direction and a spelling note. That’s enough to compare names honestly.
A worked example, labeled as hypothetical
Picture a family whose shortlist has three names straight off the top baby names 2020s tables, Theodore, Henry and James, and whose stated worry is “we don’t want him to be one of four in his class.” Using the period table: James has 72,523 boys (about 0.65%), Henry 68,047 (about 0.61%) and Theodore 65,579 (about 0.59%). On share, the three are close; none is anywhere near Liam’s 1.12%.
On direction, Theodore and Henry are gaining (both rank better in 2025 than for the period), while James is cooling slightly (No. 6 in 2025, No. 4 for the period). If the family’s worry is specifically about kids born around the same time as theirs, a gaining name may feel more common in their child’s cohort than its six-year share suggests. Even so, the national arithmetic says that in a class of 12 boys, the expected number of any one of these names is well under one. Being “one of four” isn’t what the national data predicts for any of them.
That doesn’t settle the decision. It removes a worry that the data doesn’t support and lets the family choose among the three on sound, meaning and family fit. If they’d been weighing how much uniqueness they want in the first place, our article on choosing between a popular and an uncommon name is the better place to start.
Expected namesakes: rough arithmetic for a class or a team
Share becomes much easier to feel when you scale it to a group. The calculation is simple, and it’s honest as long as you remember it’s a national average.
The formula, with an example
Expected namesakes in a group = (number of children of the same recorded sex in the group) × (the name’s share). For Olivia, with a period share of about 0.90%, a group of 15 girls born 2020–2025 would have about 0.13 Olivias on average. For Liam, a group of 15 boys gives about 0.17.
Those small numbers are why “everyone has this name” usually overstates things, even for the decade’s No. 1. They also explain why a single big school or a whole grade can contain several of a top name without anything unusual going on. Scale the same 1.12% to 300 boys and you’d expect about 3 Liams.
Why your local number will differ
The formula assumes the children around your child are a random draw from the national pool. They aren’t. Region, community, language background and local fashion all shift the mix, sometimes a lot. SSA’s state-level data is the first place to check if you think your area differs, and the period universe is national only.
The formula also ignores spelling families unless you add them in, and it ignores children born just before 2020 who’ll share school spaces with early-decade babies. Treat the result as an order-of-magnitude guide: “about none,” “maybe one,” “probably a few.” That level of precision is all the data supports for an individual setting.
5What the six-year data can’t settle for you
Period counts are good at one job: telling you how many children born so far this decade share a name in SSA’s records. They’re silent on most of what makes a name feel right, and they’re unreliable about the future. Knowing where that boundary sits keeps the data in its place.
Taste, family and meaning sit outside the dataset
No column in an SSA table records whether a name sounds good with your surname, honors someone you love, works in the languages your family speaks or survives a nickname test. Those questions are the core of the choice. Our decision framework for choosing a name puts popularity in its proper place among them.
Popularity is a description, not a score
A high count means many parents chose a name. It doesn’t mean the name is better, worse, more “basic” or more “safe.” SSA’s data describes populations; it says nothing about any individual child or family. It also says nothing about why parents chose a name. The 2025 SSA blog post mentions music, TV, sports and global trends as influences on fast risers, but that’s a general observation, not a measured cause for any particular name.
Some families actively want a widely shared name because it’s familiar and easy. Others want something few peers will have. Both are reasonable. The period counts just let each family see where a name actually falls instead of guessing from the latest headline.
Sound-alikes the counts can’t group
A name’s social footprint includes names that sound close to it, and SSA has no way to capture that. Two names can be separate entries, unrelated in origin, and still get confused at roll call. The data won’t tell you which pairs your child’s teachers and friends will mix up.
If this matters to you, it’s a listening test rather than a data question. Say the name aloud alongside the most common names in the period table and notice which ones blur. That’s subjective, and it should be; there’s no dataset for it.
Things nobody knows yet
Four birth years remain in the decade. Anyone claiming to know the final top baby names 2020s list is guessing, and SSA’s own caveat says as much. Here’s what the evidence does and doesn’t support about the rest of the decade.

Where 2026 to 2029 will land
It’s reasonable to expect names that currently rank higher in the annual list than in the period table to gain ground in the period table, because each new year adds counts at the current pace. That’s a mechanical tendency, not a forecast; annual ranks themselves can change direction. The Berger and Le Mens finding that fast adoption tends to precede faster abandonment is a further reason not to extrapolate a steep climb in a straight line.
What we can say confidently is narrower. The children born 2020–2025 already exist and are already counted. Whatever happens in 2026 through 2029 adds to those totals; it can’t subtract from them. For questions about your child’s near-peers, that existing stock is solid ground.
Whether a name will feel “dated” later
People often worry that a name strongly tied to one decade will mark a child’s age later in life. That’s a plausible social effect, but we don’t have good data on how names are perceived decades later, and the period table can’t speak to it. What the table can show is concentration: a name that’s very concentrated in a narrow set of birth years is more tied to those years than one spread evenly.
Our article on classic versus trendy names treats that trade-off as a decision, and the cluster guide to how the SSA popularity rankings fit together has the wider context on reading the annual lists alongside the period tables.
The honest summary
Use the 2020–2025 counts to answer “how many peers?” Use the recent annual ranks to answer “which way is it moving?” Use your own judgment, and your family’s, for everything else. The data is a good map of where other parents have been, and nothing more.
Questions people actually ask
Is there an official list of the top names of the 2020s?
Yes, as far as the decade goes so far. The closest thing to an official top baby names 2020s list is SSA’s own: it publishes a “Top names of the period 2020–2025” page with the 200 most common names for each recorded sex across those six birth years. It will presumably be extended as more years are released, and SSA itself calls the current version a rough indication of the final decade ranking.
Why doesn’t the period ranking match the 2025 ranking?
Because the period ranking pools births from 2020 through 2025, while the 2025 list counts only 2025 births. Names gaining ground recently rank better in 2025 than in the period table, and names that were stronger early in the decade do the opposite.
Can I add Sophia and Sofia together to get one count?
You can do the arithmetic, but SSA doesn’t, and you should say so if you publish or share the total. Whether two spellings are “the same name” is a judgment about pronunciation and perception, not a fact recorded in the data.
Do the period counts include every baby born in the U.S.?
They count names on Social Security card applications in SSA’s records as of the stated snapshot date, and names with fewer than five occurrences are withheld for privacy. That covers the top names well but isn’t a complete birth census, so treat the counts as SSA’s records, not a perfect tally.
How do I check a name that isn’t in the period top 200?
Look it up year by year with SSA’s search tools for 2020 through 2025, write down each annual count, and add them. Divide by the period universe for a share. Expect very small numbers to be missing in some years because of the five-occurrence privacy threshold.
Does a name being in the top 10 mean my child will share it with classmates?
Not necessarily. Even Liam, the decade’s leader so far, works out to about 1.12% of boys nationally, so a typical class has a fraction of one on average. Local patterns can push that up or down, which is why state data and your own community matter.
Sources and further reading
- SSA: Top names of the period 2020–2025 — the pooled six-year counts, ranks and universe totals used throughout this page.
- SSA Popular Baby Names — the landing page with the 2025 top 10 and search tools by year, decade and state.
- SSA press release, May 8, 2026 — the official 2025 top 10 and the year’s notable changes and risers.
- SSA: Top 5 names in each of the last 100 years — year-by-year top-five history for tracing a name’s direction.
- SSA: Background information — data source, spelling rules, privacy threshold and tie-breaking.
- SSA: Top names of the 2010s — the full-decade comparison table and its universe totals.
- SSA: Change in popularity, 2024 to 2025 — how SSA computes rank changes and which names it includes.
- Berger and Le Mens (2009), PNAS — research linking fast adoption of first names to faster abandonment.
NameLooks provides general information. Popularity figures describe populations of names in SSA’s records, not individual children or families, and shares on this page are our own calculations from SSA’s published counts.